Altered adenosine-to-inosine RNA editing in human cancer - PubMed (original) (raw)
Comparative Study
. 2007 Nov;17(11):1586-95.
doi: 10.1101/gr.6493107. Epub 2007 Oct 1.
Erez Y Levanon, Ninette Amariglio, Amy B Heimberger, Zvi Ram, Shlomi Constantini, Zohar S Barbash, Konstantin Adamsky, Michal Safran, Avi Hirschberg, Meir Krupsky, Issachar Ben-Dov, Simona Cazacu, Tom Mikkelsen, Chaya Brodie, Eli Eisenberg, Gideon Rechavi
Affiliations
- PMID: 17908822
- PMCID: PMC2045141
- DOI: 10.1101/gr.6493107
Comparative Study
Altered adenosine-to-inosine RNA editing in human cancer
Nurit Paz et al. Genome Res. 2007 Nov.
Abstract
Adenosine-to-inosine (A-to-I) RNA editing was recently shown to be abundant in the human transcriptome, affecting thousands of genes. Employing a bioinformatic approach, we identified significant global hypoediting of Alu repetitive elements in brain, prostate, lung, kidney, and testis tumors. Experimental validation confirmed this finding, showing significantly reduced editing in Alu sequences within MED13 transcripts in brain tissues. Looking at editing of specific recoding and noncoding sites, including in cancer-related genes, a more complex picture emerged, with a gene-specific editing pattern in tumors vs. normal tissues. Additionally, we found reduced RNA levels of all three editing mediating enzymes, ADAR, ADARB1, and ADARB2, in brain tumors. The reduction of ADARB2 correlated with the grade of malignancy of glioblastoma multiforme, the most aggressive of brain tumors, displaying a 99% decrease in ADARB2 RNA levels. Consistently, overexpression of ADAR and ADARB1 in the U87 glioblastoma multiforme cell line resulted in decreased proliferation rate, suggesting that reduced A-to-I editing in brain tumors is involved in the pathogenesis of cancer. Altered epigenetic control was recently shown to play a central role in oncogenesis. We suggest that A-to-I RNA editing may serve as an additional epigenetic mechanism relevant to cancer development and progression.
Figures
Figure 1.
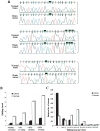
Reduced editing levels at Alu sequences in a human brain tumor. (A) Three representative clusters from the direct sequencing of an Alu sequence located in intron 9 of the MED13 gene of normal and tumor brain (low-grade glioma) tissues are illustrated. Black boxes indicate the editing sites. (B) Alu editing in individually cloned transcripts from normal and malignant brain tissues. PCR products derived from the normal and astrocytoma samples (shown in panel A) were cloned and sequenced. One-hundred-twenty-one clones were sequenced (46 clones from astrocytoma and 75 clones from normal brain tissue). Thirty-four “As” were shown to be edited at least in one of the clones. The percent of editing was analyzed in all sites and is displayed according to cutoff values of >5%, 30%, and 50% editing. White bars represent transcripts from normal brain tissue, and black bars represent clones from brain tumor. (C) Analysis of editing level of Alu sequences in intron 9 of MED13 in individual clones. MED13 transcripts from both normal and malignant brain samples were cloned and sequenced (same samples as in panel A); 71% of the cancer clones, compared to only 21% of the normal clones, do not undergo editing at any site.
Figure 2.
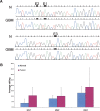
Elevated editing levels in BRCA1 transcript in brain tumor vs. normal tissues; editing sites in an Alu element in the second intron of the BRCA1 gene. (A) Direct sequencing of the BRCA1 transcripts from representative samples taken from normal (N) and glioblastoma multiforme (GBM) brain tissues. A-to-I editing is detected as guanosine trace and indicated by a black box. (B) Average editing levels in BRCA1 transcripts in normal (n = 9) and brain tumor (n = 29) tissues. Editing levels at site 1 are 2.9-fold higher (P < 0.04) in the cancerous tissues relative to the normal control (10.7% vs. 3.7%). Site 2 shows 1.3-fold higher editing efficiency (10.2% editing in brain tumors compared to 7.9% in the normal brains; P < 0.04). Similarly, site 3 presents 1.4-fold elevated editing level in the tumoral tissue (18.5% compared to 13.0%; P = of 0.04).
Figure 3.
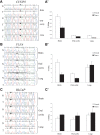
Site-specific editing at coding sequences in normal vs. tumor tissues; direct sequencing of the CYFIP2, FLNA, and BLCAP genes (A–C) from representative samples taken from normal and cancer tissues (brain, oral cavity, and lung). Editing position is indicated by a black box. A-to-I editing is detected as guanosine trace when products were sequenced with the forward primer and as cytidine trace when reverse primer was used for sequencing. Paired normal and tumor tissues from lung and oral cavity were taken from the same individual. (_A_′–_C_′) Average editing levels of CYFIP2, FLNA, and BLCAP in normal and cancer tissues. Normal and tumor samples are indicated by white and black bars, respectively. Error bars represent SEM (_A_–_A_′) CYFIP2 shows the highest editing percentages in brain tissues, with pronounced 2.4-fold higher editing levels in normal vs. tumor brains (51.5% [n = 13] and 22.3% [n = 27], respectively; P = 0.002). (_B_–_B_′) Highest editing percentages of FLNA were detected in the brain tissue, with a significant 2.4-fold higher editing in normal vs. tumor brains (21.4% [n = 13] and 8.8% [n = 31], respectively; P = 0.0001). (_C_–_C_′) Minor increase in editing level of BLCAP is detected in different types of tumors, with 1.3-fold (P = 0.03) in the brain (20.9% [n = 24] and 16.4% [n = 12], respectively; P = 0.03).
Figure 4.
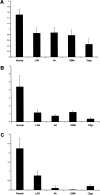
Reduced RNA level of the ADAR family is detected in human brain tumors. Real-time PCR analysis was performed in order to quantify the relative RNA levels of ADAR, ADARB1, and ADARB2 in normal and in different grades and types (according to WHO classification) of brain tumors. Values were normalized using S12, and the ΔΔCt method was applied. The y axis represents the relative ADARs expression level of (A) ADAR, (B) ADARB1, and (C) ADARB2. Error bars represent SEM. LGA, low-grade astrocytomas; AA, anaplastic astrocytomas; GBM, glioblastomas multiforme; Oligo, oligodendrogliomas.
Figure 5.
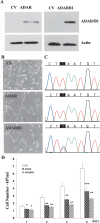
Overexpression of ADAR and ADARB1 decreases glioma cell proliferation. U87 cells were transfected with ADAR, ADARB1, and a control empty expression vector (CV). After 24 h, expression of ADAR proteins was examined using Western blot analysis (A). Cells were plated (5 × 10⁴/mL) on plastic dishes. Morphology of the cells was assessed after 24 h (B) using a phase-contrast microscope (original magnification, ×20). Direct sequencing of CYFIP2 editing site in U87 transfected cells (C). Cell number was monitored at 24-h intervals (D). Results represent the means ± SE of three independent experiments. Asterisks represent P values: *P < 0.01, **P < 10−3, ***P < 2 × 10⁻³.
Similar articles
- Comparative genomic and bioinformatic approaches for the identification of new adenosine-to-inosine substrates.
Sixsmith J, Reenan RA. Sixsmith J, et al. Methods Enzymol. 2007;424:245-64. doi: 10.1016/S0076-6879(07)24011-X. Methods Enzymol. 2007. PMID: 17662844 - Widespread A-to-I RNA editing of Alu-containing mRNAs in the human transcriptome.
Athanasiadis A, Rich A, Maas S. Athanasiadis A, et al. PLoS Biol. 2004 Dec;2(12):e391. doi: 10.1371/journal.pbio.0020391. Epub 2004 Nov 9. PLoS Biol. 2004. PMID: 15534692 Free PMC article. - Alu sequences in undifferentiated human embryonic stem cells display high levels of A-to-I RNA editing.
Osenberg S, Paz Yaacov N, Safran M, Moshkovitz S, Shtrichman R, Sherf O, Jacob-Hirsch J, Keshet G, Amariglio N, Itskovitz-Eldor J, Rechavi G. Osenberg S, et al. PLoS One. 2010 Jun 21;5(6):e11173. doi: 10.1371/journal.pone.0011173. PLoS One. 2010. PMID: 20574523 Free PMC article. - In cancer, A-to-I RNA editing can be the driver, the passenger, or the mechanic.
Ganem NS, Ben-Asher N, Lamm AT. Ganem NS, et al. Drug Resist Updat. 2017 May;32:16-22. doi: 10.1016/j.drup.2017.09.001. Epub 2017 Oct 4. Drug Resist Updat. 2017. PMID: 29145975 Review. - Adenosine-to-inosine RNA editing meets cancer.
Dominissini D, Moshitch-Moshkovitz S, Amariglio N, Rechavi G. Dominissini D, et al. Carcinogenesis. 2011 Nov;32(11):1569-77. doi: 10.1093/carcin/bgr124. Epub 2011 Jun 29. Carcinogenesis. 2011. PMID: 21715563 Review.
Cited by
- MicroRNA-mediated loss of ADAR1 in metastatic melanoma promotes tumor growth.
Nemlich Y, Greenberg E, Ortenberg R, Besser MJ, Barshack I, Jacob-Hirsch J, Jacoby E, Eyal E, Rivkin L, Prieto VG, Chakravarti N, Duncan LM, Kallenberg DM, Galun E, Bennett DC, Amariglio N, Bar-Eli M, Schachter J, Rechavi G, Markel G. Nemlich Y, et al. J Clin Invest. 2013 Jun;123(6):2703-18. doi: 10.1172/JCI62980. J Clin Invest. 2013. PMID: 23728176 Free PMC article. - RNA editing of the GLI1 transcription factor modulates the output of Hedgehog signaling.
Shimokawa T, Rahman MF, Tostar U, Sonkoly E, Ståhle M, Pivarcsi A, Palaniswamy R, Zaphiropoulos PG. Shimokawa T, et al. RNA Biol. 2013 Feb;10(2):321-33. doi: 10.4161/rna.23343. Epub 2013 Jan 16. RNA Biol. 2013. PMID: 23324600 Free PMC article. - ctDNA applications and integration in colorectal cancer: an NCI Colon and Rectal-Anal Task Forces whitepaper.
Dasari A, Morris VK, Allegra CJ, Atreya C, Benson AB 3rd, Boland P, Chung K, Copur MS, Corcoran RB, Deming DA, Dwyer A, Diehn M, Eng C, George TJ, Gollub MJ, Goodwin RA, Hamilton SR, Hechtman JF, Hochster H, Hong TS, Innocenti F, Iqbal A, Jacobs SA, Kennecke HF, Lee JJ, Lieu CH, Lenz HJ, Lindwasser OW, Montagut C, Odisio B, Ou FS, Porter L, Raghav K, Schrag D, Scott AJ, Shi Q, Strickler JH, Venook A, Yaeger R, Yothers G, You YN, Zell JA, Kopetz S. Dasari A, et al. Nat Rev Clin Oncol. 2020 Dec;17(12):757-770. doi: 10.1038/s41571-020-0392-0. Epub 2020 Jul 6. Nat Rev Clin Oncol. 2020. PMID: 32632268 Free PMC article. Review. - Identification of widespread ultra-edited human RNAs.
Carmi S, Borukhov I, Levanon EY. Carmi S, et al. PLoS Genet. 2011 Oct;7(10):e1002317. doi: 10.1371/journal.pgen.1002317. Epub 2011 Oct 20. PLoS Genet. 2011. PMID: 22028664 Free PMC article. - Differential regulation of aggressive features in melanoma cells by members of the miR-17-92 complex.
Greenberg E, Hajdu S, Nemlich Y, Cohen R, Itzhaki O, Jacob-Hirsch J, Besser MJ, Schachter J, Markel G. Greenberg E, et al. Open Biol. 2014 Jun;4(6):140030. doi: 10.1098/rsob.140030. Open Biol. 2014. PMID: 24920276 Free PMC article.
References
- Bhalla K.N. Epigenetic and chromatin modifiers as targeted therapy of hematologic malignancies. J. Clin. Oncol. 2005;23:3971–3993. - PubMed
- Blow M.J., Grocock R.J., van Dongen S., Enright A.J., Dicks E., Futreal P.A., Wooster R., Stratton M.R., Grocock R.J., van Dongen S., Enright A.J., Dicks E., Futreal P.A., Wooster R., Stratton M.R., van Dongen S., Enright A.J., Dicks E., Futreal P.A., Wooster R., Stratton M.R., Enright A.J., Dicks E., Futreal P.A., Wooster R., Stratton M.R., Dicks E., Futreal P.A., Wooster R., Stratton M.R., Futreal P.A., Wooster R., Stratton M.R., Wooster R., Stratton M.R., Stratton M.R. RNA editing of human microRNAs. Genome Biol. 2006;7:R27. - PMC - PubMed
Publication types
MeSH terms
Substances
LinkOut - more resources
Full Text Sources
Other Literature Sources
