Comparative metagenomics revealed commonly enriched gene sets in human gut microbiomes - PubMed (original) (raw)
Comparative Study
. 2007 Aug 31;14(4):169-81.
doi: 10.1093/dnares/dsm018. Epub 2007 Oct 3.
Takehiko Itoh, Tomomi Kuwahara, Kenshiro Oshima, Hidehiro Toh, Atsushi Toyoda, Hideto Takami, Hidetoshi Morita, Vineet K Sharma, Tulika P Srivastava, Todd D Taylor, Hideki Noguchi, Hiroshi Mori, Yoshitoshi Ogura, Dusko S Ehrlich, Kikuji Itoh, Toshihisa Takagi, Yoshiyuki Sakaki, Tetsuya Hayashi, Masahira Hattori
Affiliations
- PMID: 17916580
- PMCID: PMC2533590
- DOI: 10.1093/dnares/dsm018
Comparative Study
Comparative metagenomics revealed commonly enriched gene sets in human gut microbiomes
Ken Kurokawa et al. DNA Res. 2007.
Abstract
Numerous microbes inhabit the human intestine, many of which are uncharacterized or uncultivable. They form a complex microbial community that deeply affects human physiology. To identify the genomic features common to all human gut microbiomes as well as those variable among them, we performed a large-scale comparative metagenomic analysis of fecal samples from 13 healthy individuals of various ages, including unweaned infants. We found that, while the gut microbiota from unweaned infants were simple and showed a high inter-individual variation in taxonomic and gene composition, those from adults and weaned children were more complex but showed a high functional uniformity regardless of age or sex. In searching for the genes over-represented in gut microbiomes, we identified 237 gene families commonly enriched in adult-type and 136 families in infant-type microbiomes, with a small overlap. An analysis of their predicted functions revealed various strategies employed by each type of microbiota to adapt to its intestinal environment, suggesting that these gene sets encode the core functions of adult and infant-type gut microbiota. By analysing the orphan genes, 647 new gene families were identified to be exclusively present in human intestinal microbiomes. In addition, we discovered a conjugative transposon family explosively amplified in human gut microbiomes, which strongly suggests that the intestine is a 'hot spot' for horizontal gene transfer between microbes.
Figures
Figure 1
Clustering analysis of microbiomes based on cumulative bitscore comparisons. MDS was applied to the distance matrix calculated from reciprocal pairwise BLASTP analysis among all predicted gene products. The dots represent fecal samples from adults and children (blue), unweaned infants (red), Americans (green), and samples from other natural environments (orange). Whale falls 1–3, Sargasso and soil indicate the metadata for microbial communities from the deep sea,39 surface seawater,26 and the surface soil of a farm,39 respectively.
Figure 2
Compositional view of human intestinal microbiomes. A compositional view of microbiomes based on the taxonomic assignment of protein-coding genes is shown. The stacked bars represent the compositions of each sample estimated from the results of BLASTP analysis with a 90% threshold identity. ‘Others’ includes the genera whose proportions were less than 1% in any of the samples. The data for the fecal samples from two American adults (‘Sub. 7’ and ‘Sub. 8’) are also shown.
Figure 3
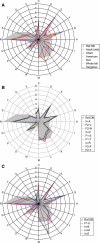
Summary of the COG assignment of predicted genes. (A) Comparison of the distribution patterns of COG-assigned genes between each type of microbiome and Ref-DB (for Ref-DB, see ‘Materials and methods’). Fecal samples from Japanese adults and children (nine samples), Japanese infants (four) and American adults (two), and three samples from whale fall were each averaged. (B) Distribution of COG-assigned genes in the nine microbiomes from adults and children. (C) Distribution of COG-assigned genes in the four microbiomes from unweaned infants; C: Energy production and conversion; D: Cell cycle control, mitosis, and meiosis; E: Amino acid transport and metabolism; F: Nucleotide transport and metabolism; G: Carbohydrate transport and metabolism; H: Coenzyme transport and metabolism; I: Lipid transport and metabolism; J: Translation; K: Transcription; L: Replication, recombination and repair; M: Cell wall/membrane biogenesis; N: Cell motility; O: Post-translational modification, protein turnover, chaperones; P: Inorganic ion transport and metabolism; Q: Secondary metabolites biosynthesis, transport and catabolism; R: General function prediction only; S: Function unknown; T: Signal transduction mechanisms; U: Intracellular trafficking and secretion; V: Defense mechanisms. The genes not assignable to any COGs are not shown in this figure.
Figure 4
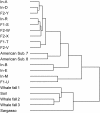
Relationship between human intestinal microbiomes and other-environmental microbiomes based on their functional profiles. The result of a clustering analysis of microbiomes based on the enrichment values of each COG calculated for each microbiome is shown. The matrix was clustered independently in the samples and COGs using the pairwise complete-linkage hierarchical clustering of the uncentered correlation (cluster-1.31). Also, see Supplementary Fig. S1.
Figure 5
Functional distribution of commonly enriched COGs. The functional distribution of commonly enriched COGs in adult/child microbiomes (‘A-gutCEGs’), in infant microbiomes (‘I-gutCEGs’), or in both types of microbiomes is shown: see Fig. 3 for the COG categorization.
Figure 6
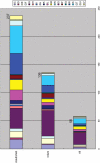
The Tn_1549_-like CTn family, ‘CTnRINT’, explosively amplified in human gut microbiomes. (A) Numbers of genes homologous to those on six known Tn_1549_-like CTns. Genes derived from each fecal sample are shown in different colors. Plum: In-A; brown: F2-V; light yellow: F2-W; light cyan: In-D; dark red: F1-S; salmon: F1-T; royal blue: In-R; pale turquoise: F2-X; midnight blue: F2-Y; magenta: F1-U; yellow: In-B; cyan: In-M; and maroon: In-E. (B) Gene organizations of six known Tn_1549_-like CTns. Tn_1549_ from E. faecalis strain BM4382, an unnamed CTn from E. faecalis V583, CTn4, CTn2 and CTn5 from C. difficile, and an unnamed CTn from S. pyogenes MGAS10750 are shown. Pentagons and circles represent ORFs. ORFs in the conserved regions are depicted in green, and orthologues are connected with pink vertical lines. The three ORFs depicted in blue are tentatively positioned in this figure to more clearly show their orthologous relationships, and their actual positions are indicated by dotted arrow lines. Orange pentagons represent the accessory genes of the six CTns. Those from Tn_1549_ and the CTn of E. faecalis V583 include vancomycin-resistance genes.30,32 (C) Sequence diversity of the Tn_1549_-like CTn family (‘CTnRINT’). All the CTnRINT-related gene products were searched for their best-hit homologues among those on the six known CTnRINT family members. The six columns represent Tn_1549_, the CTn from E. faecalis V583, CTn4, CTn2 and CTn5 from C. difficile, and the CTn from S. pyogenes MGAS10750, respectively (from left to right). The BLASTP identity (%) for a CTnRINT-related gene product was plotted in the CTn column where its best-hit homologue was identified.
References
- Backhed F., Ley R. E., Sonnenburg J. L., Peterson D. A., Gordon J. I. Host-bacterial mutualism in the human intestine. Science. 2005;307:1915–1920. - PubMed
- Ley R. E., Peterson D. A., Gordon J. I. Ecological and evolutionary forces shaping microbial diversity in the human intestine. Cell. 2006;124:837–848. - PubMed
- Savage D. C. Microbial biota of the human intestine: a tribute to some pioneering scientists. Curr. Issues. Intest. Microbiol. 2001;2:1–15. - PubMed
- Tancrede C. Role of human microflora in health and disease. Eur J Clin Microbiol. Infect. Dis. 1992;11:1012–1015. - PubMed
Publication types
MeSH terms
LinkOut - more resources
Full Text Sources
Other Literature Sources
Molecular Biology Databases


