CD11cloB220+ interferon-producing killer dendritic cells are activated natural killer cells - PubMed (original) (raw)
CD11cloB220+ interferon-producing killer dendritic cells are activated natural killer cells
Christian A J Vosshenrich et al. J Exp Med. 2007.
Abstract
Interferon-producing killer dendritic cells (IKDCs) are a recently described subset of CD11c(lo)B220(+) cells that share phenotypic and functional properties of DCs and natural killer (NK) cells (Chan, C.W., E. Crafton, H.N. Fan, J. Flook, K. Yoshimura, M. Skarica, D. Brockstedt, T.W. Dubensky, M.F. Stins, L.L. Lanier, et al. 2006. Nat. Med. 12:207-213; Taieb, J., N. Chaput, C. Menard, L. Apetoh, E. Ullrich, M. Bonmort, M. Pequignot, N. Casares, M. Terme, C. Flament, et al. 2006. Nat. Med. 12:214-219). IKDC development appears unusual in that cytokines using the interleukin (IL)-2 receptor beta (IL-2Rbeta) chain but not those using the common gamma chain (gamma(c)) are necessary for their generation. By directly comparing Rag2(-/-)gamma(c)(-/y), Rag2(-/-)IL-2Rbeta(-/-), Rag2(-/-)IL-15(-/-), and Rag2(-/-)IL-2(-/-) mice, we demonstrate that IKDC development parallels NK cell development in its strict IL-15 dependence. Moreover, IKDCs uniformly express NK-specific Ncr-1 transcripts (encoding NKp46), whereas NKp46(+) cells are absent in Ncr1(gfp/+)gamma(c)(-/y) mice. Distinguishing features of IKDCs (CD11c(lo)B220(+)MHC-II(+)) were carefully examined on developing NK cells in the bone marrow and on peripheral NK cells. As B220 expression was heterogeneous, defining B220(lo) versus B220(hi) NK1.1(+) NK cells could be considered as arbitrary, and few phenotypic differences were noted between NK1.1(+) NK cells bearing different levels of B220. CD11c expression did not correlate with B220 or major histocompatibility complex (MHC) class II (MHC-II) expression, and most MHC-II(+) NK1.1(+) cells did not express B220 and were thus not IKDCs. Finally, CD11c, MHC-II, and B220 levels were up-regulated on NK1.1(+) cells upon activation in vitro or in vivo in a proliferation-dependent fashion. Our data suggest that the majority of CD11c(lo)B220(+) "IKDC-like" cells represent activated NK cells.
Figures
Figure 1.
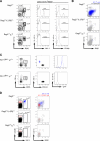
NK1.1+CD11cloB220+ (IKDC-like) cells are NK cells. (A) Analysis of BM cells from Rag2−/− (top row), Rag2−/−IL-2Rβ−/− (middle row), and Rag2−/−γc −/y (bottom row) mice. CD11c versus B220 profiles of BM cells from the indicated mice (left) with gates for cDCs (dotted line) and pDCs (continuous line) with their absolute cell numbers are given. (middle and right) NK1.1 and CD49b histograms, respectively, of the gated CD11cloB220+ cells from the left. The percentages of NK1.1+ (middle) and CD49b+ (right) cells among gated CD11cloB220+ cells are indicated. (B) Analysis of splenocytes from the same mice as in A. Shown are population overlays of viable cells (gray) with NK1.1+CD49b+ cells (blue). (C) Analysis of ncr1gfp/+γc+/+ and ncr1gfp/+γc−/y mice. (left) CD11c versus B220 profile of gated CD3−CD19− splenocytes of the indicated mice. (middle) PDCA-1 versus NK1.1 profiles on gated CD11cloB220+ cells. (right) GFP fluorescence (NKp46 expression) on gated NK1.1+ and PDCA-1+ cells. (D) NK1.1 versus CD49b profile of BM cells from the same mice as in A. (left) The gates indicate CD49b+NK1.1− (red) and NK1.1+ (blue) cells, respectively, and the absolute cell numbers are indicated. (right) A population overlay of the gated populations for CD11c versus B220 expression. The results shown are representative of two to three animals per genotype.
Figure 2.
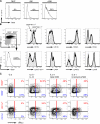
Phenotype and function of B220− and B220+ NK cells. (A) B220 expression on BM NK cell precursors (CD122+NK1.1−CD49b−; left), immature NK cells (CD122+NK1.1+CD49b−; middle), and mature NK cells (CD122+NK1.1+CD49b+; right) from Rag2−/− mice. (B) Splenocytes from Rag2−/− mice analyzed for NK1.1 and B220 expression. (top left) The distribution of NK1.1+ cells expressing B220 and the gating for B220− and B220+ NK cells. (bottom left) Histogram shows the B220 expression on the same gated NK1.1+ cells. The range of percentages of B220+ cells among total NK1.1+ cells is given (n = 10). The remaining histograms show overlays of CD11c, CD11b, CD62L, and CD94 (top, from left to right) and Ly49C/I, Ly49A, Ly49G2, and Ly49D (bottom, from left to right) expressed by B220+NK1.1+ cells (continuous line) and B220−NK1.1+ cells (shaded) from Rag2−/− splenocytes. (C) Expression of IFN-γ in NK1.1+ cells in relation to B220 expression (top) and CD11c expression (bottom). NK cells above the horizontal bar are B220+ (top) or CD11c+ (bottom), and the red numbers indicate the percentage of IFN-γ+ cells among total B220+ or CD11c+ NK1.1+ cells, respectively. The cells below the horizontal bar are B220− (top) or CD11c− (bottom), and the blue numbers indicate the percentage of IFN-γ+ cells in total B220− or CD11c− NK1.1+ cells, respectively. The results shown are representative of two to three experiments. iNK, immature NK cell; mNK, mature NK cell; NKP, NK cell precursor.
Figure 3.
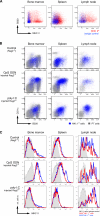
Activation-induced expression of B220, CD11c, and MHC-II by NK1.1+ cells. (A) MHC-II versus B220 expression (red) of gated CD3−CD19−NK1.1+ BM (left), spleen (middle), and lymph node (right) cells from C57BL/6 mice. The blue staining represents the isotype control for the anti–MHC-II antibodies. (B) Population overlays of NK1.1+ cells (blue) on CD11c versus B220 dot plots of total cells (gray) from the BM (left), spleen (middle), and lymph nodes (right) harvested from Rag2−/− mice injected with PBS (top row), CpG ODN 1668 (middle row), or poly I:C (bottom row). (C) Expression of MHC-II molecules by B220+NK1.1+ (red) and B220−NK1.1+ (blue) cells from the same mice and organs analyzed in B. Shaded histograms represent isotype control staining by NK1.1+ cells from the respective mice and organs. The results shown are representative of three to five experiments.
Figure 4.
Dynamic B220 expression by NK1.1+ cells. (A) Total CFSE-labeled splenocytes from Rag2−/− mice were cultured with IL-2. At the indicated times, cells were harvested and analyzed for B220 expression. The values of mean fluorescence intensity (MFI) indicate the expression level of B220 at the cell surface of the NK1.1+ cells analyzed. (B) Expression of B220 by sorted B220+ (shaded) or B220− (continuous line) NK1.1+CD49b+ cells from Rag2−/− mice after 7 d of culture in IL-2. The results shown are representative of three experiments. (C, left) The dot plot indicates the gates used to sort B220−NK1.1+ cells (left gate) and B220+NK1.1+ cells (right gate) from Rag2−/− mice. The sorted cells were adoptively transferred into NK cell–proficient (Rag2−/−) or NK cell–deficient (Rag2−/−IL-2Rβ−/−) hosts. Some of the NK cell–proficient hosts receiving B220−NK1.1+ cells were injected with poly I:C at the day of transfer. (middle) CFSE dilution of NK1.1+ cells 3 d after transfer of B220− (top) and B220+ (bottom) cells into the indicated hosts. (right) The histograms show the expression levels of B220 by the transferred cells 3 d after the transfer, as indicated. The colors in the histograms match the populations defined by the dashed ovals in the middle panels. The results shown are representative of two to five animals per group from two to three experiments.
Figure 5.
T cell stimulatory potential of NK1.1+ NK cells is independent of B220 expression. Sorted B220−NK1.1+ cells, B220+NK1.1+ cells, pDCs, and cDCs from CpG ODN 1668−treated mice (3 d before the sort) were incubated with the MHC-II–restricted H-Y peptide Dby and co-cultured with sorted, CFSE-labeled Vβ6+CD4+ T cells from Marilyn TCR transgenic mice. 3 d later, cells were harvested and analyzed for the CFSE dilution. The percentages of cells having undergone one or more cell divisions are indicated. Sorted B220−NK1.1+ cells, B220+NK1.1+ cells, pDCs, and cDCs that were not incubated with the Dby peptide failed to stimulate proliferation of Marilyn T cells (not depicted). The results shown are representative of two animals per group.
Similar articles
- Development and function of murine B220+CD11c+NK1.1+ cells identify them as a subset of NK cells.
Blasius AL, Barchet W, Cella M, Colonna M. Blasius AL, et al. J Exp Med. 2007 Oct 29;204(11):2561-8. doi: 10.1084/jem.20070991. Epub 2007 Oct 8. J Exp Med. 2007. PMID: 17923504 Free PMC article. - Putative IKDCs are functionally and developmentally similar to natural killer cells, but not to dendritic cells.
Caminschi I, Ahmet F, Heger K, Brady J, Nutt SL, Vremec D, Pietersz S, Lahoud MH, Schofield L, Hansen DS, O'Keeffe M, Smyth MJ, Bedoui S, Davey GM, Villadangos JA, Heath WR, Shortman K. Caminschi I, et al. J Exp Med. 2007 Oct 29;204(11):2579-90. doi: 10.1084/jem.20071351. Epub 2007 Oct 8. J Exp Med. 2007. PMID: 17923506 Free PMC article. - IL-15 Generates IFN-γ-producing Cells Reciprocally Expressing Lymphoid-Myeloid Markers during Dendritic Cell Differentiation.
Kwon KW, Kim SJ, Kim H, Kim WS, Kang SM, Choi E, Ha SJ, Yoon JH, Shin SJ. Kwon KW, et al. Int J Biol Sci. 2019 Jan 1;15(2):464-480. doi: 10.7150/ijbs.25743. eCollection 2019. Int J Biol Sci. 2019. PMID: 30745835 Free PMC article. - Licensing of killer dendritic cells in mouse and humans: functional similarities between IKDC and human blood γδ T-lymphocytes.
Anderson J, Gustafsson K, Himoudi N. Anderson J, et al. J Immunotoxicol. 2012 Jul-Sep;9(3):259-66. doi: 10.3109/1547691X.2012.685528. Epub 2012 May 27. J Immunotoxicol. 2012. PMID: 22632132 Review. - Implications of a 'Third Signal' in NK Cells.
Khalil M, Wang D, Hashemi E, Terhune SS, Malarkannan S. Khalil M, et al. Cells. 2021 Jul 31;10(8):1955. doi: 10.3390/cells10081955. Cells. 2021. PMID: 34440725 Free PMC article. Review.
Cited by
- Mouse Nkrp1-Clr gene cluster sequence and expression analyses reveal conservation of tissue-specific MHC-independent immunosurveillance.
Zhang Q, Rahim MM, Allan DS, Tu MM, Belanger S, Abou-Samra E, Ma J, Sekhon HS, Fairhead T, Zein HS, Carlyle JR, Anderson SK, Makrigiannis AP. Zhang Q, et al. PLoS One. 2012;7(12):e50561. doi: 10.1371/journal.pone.0050561. Epub 2012 Dec 4. PLoS One. 2012. PMID: 23226525 Free PMC article. - Adaptive immune responses mediated by natural killer cells.
Paust S, Senman B, von Andrian UH. Paust S, et al. Immunol Rev. 2010 May;235(1):286-96. doi: 10.1111/j.0105-2896.2010.00906.x. Immunol Rev. 2010. PMID: 20536570 Free PMC article. Review. - An early T cell lineage commitment checkpoint dependent on the transcription factor Bcl11b.
Li L, Leid M, Rothenberg EV. Li L, et al. Science. 2010 Jul 2;329(5987):89-93. doi: 10.1126/science.1188989. Science. 2010. PMID: 20595614 Free PMC article. - Anticancer Mechanisms in Two Murine Bone Marrow-Derived Dendritic Cell Subsets Activated with TLR4 Agonists.
Bagaev A, Pichugin A, Nelson EL, Agadjanyan MG, Ghochikyan A, Ataullakhanov RI. Bagaev A, et al. J Immunol. 2018 Apr 15;200(8):2656-2669. doi: 10.4049/jimmunol.1701126. Epub 2018 Mar 2. J Immunol. 2018. PMID: 29500244 Free PMC article. - An overview on non-T cell pathways in transplant rejection and tolerance.
Liu W, Li XC. Liu W, et al. Curr Opin Organ Transplant. 2010 Aug;15(4):422-6. doi: 10.1097/MOT.0b013e32833b7903. Curr Opin Organ Transplant. 2010. PMID: 20531193 Free PMC article. Review.
References
- Degli-Esposti, M.A., and M.J. Smyth. 2005. Close encounters of different kinds: dendritic cells and NK cells take centre stage. Nat. Rev. Immunol. 5:112–124. - PubMed
- Chan, C.W., E. Crafton, H.N. Fan, J. Flook, K. Yoshimura, M. Skarica, D. Brockstedt, T.W. Dubensky, M.F. Stins, L.L. Lanier, et al. 2006. Interferon-producing killer dendritic cells provide a link between innate and adaptive immunity. Nat. Med. 12:207–213. - PubMed
Publication types
MeSH terms
Substances
LinkOut - more resources
Full Text Sources
Other Literature Sources
Molecular Biology Databases
Research Materials


