Longitudinal, quantitative assessment of amyloid, neuroinflammation, and anti-amyloid treatment in a living mouse model of Alzheimer's disease enabled by positron emission tomography - PubMed (original) (raw)
Figure 1.
Amyloidosis-associated accumulation of [11C]PIB in ex vivo autoradiographic analysis of APP Tg mouse brains. A, Binding of the radiotracer to putative amyloid plaques primarily located in the neocortex and hippocampus of Tg mice. Images were obtained 30 min after tracer administration. Top and bottom panels represent coronal images at 2 and 7 mm posterior to the bregma, respectively. mo, Month. B, C, Levels of radiotracer at 30 min after injection in the hippocampus, neocortex, and cerebellum of APP Tg (filled bars; n = 4; age, 21.0 ± 0.51 months) and age-matched WT (open bars; n = 5; age, 19.0 ± 1.0 months) mice, indicated as %ID/ml (B) and %ID · kg/ml (C). There were significant main effects of brain regions and genotypes on both %ID/ml (region, F(2,12) = 16.6, p < 0.01; genotype, _F_(1,6) = 14.7, _p_ < 0.01; 2-way, repeated-measures ANOVA) and %ID · kg/ml (region, _F_(2,12) = 33.9, _p_ < 0.001; genotype, _F_(1,6) = 54.3, _p_ < 0.001; 2-way, repeated-measures ANOVA). **_D_**, Target-to-cerebellum ratio of radiotracer levels in the hippocampus and neocortex. The ratio was significantly increased in Tg mice (filled bars) relative to WT mice (open bars) (significant main effect of genotype; _F_(1,6) = 17.0; _p_ < 0.01; 2-way, repeated-measures ANOVA). **_E_**, Coronal brain section (at 2 mm posterior to the bregma) obtained from a 20.2-month-old Tg mouse. An _ex vivo_ autoradiographic image (top left) depicts radiotracer distribution at 30 min after intravenous administration. The same sections were subsequently stained with a fluorescent amyloid dye, FSB (bottom left). Merged images (top right) explicitly demonstrate intense accumulation of radiotracer in close association with amyloid plaques. The sections were finally immunostained with anti-Aβ antibody 6E10, and spatial concordance between intense radioactive signals and Aβ-immunoreactive plaques were confirmed (bottom right). **_F_**, High-power view of the autoradiographic image overlaid on FSB fluorescence in the neocortical (top panel) and thalamic (bottom panel) regions of the mouse brain shown in **_E_** (indicated by red and green squares, respectively). Arrows indicate vascular amyloid. **_G_**, Age-associated increase in radiotracer binding in the hippocampus and neocortex of Tg mice (_n_ = 6; age, 21.9 ± 2.0 months; range, 16.3–31.1 months). The correlation between age and radiotracer binding was significant in these plaque-bearing regions (hippocampus, _R_2 = 0.76 and _p_ < 0.01 by _t_ test; neocortex, _R_2 = 0.77 and _p_ < 0.01 by _t_ test), in contrast to the cerebellar levels of the tracer unrelated to age (_R_2 = 0.08; _p_ > 0.05, t test). H, Scatterplot of radiotracer uptake versus amyloid burden (indicated as percentage of target brain area) in the hippocampus and neocortex of Tg mice (n = 6; age, 21.9 ± 2.0 months; range, 16.3–31.1 months), with the correlation of the two parameters being statistically significant in both regions (_R_2 = 0.96 and 0.97 for hippocampus and neocortex, respectively; p < 0.01, t test). Solid, dotted, and dashed lines in the graphs represent regressions for the hippocampus, neocortex, and cerebellum, respectively. Error bars represent SE. Hi, Hippocampus; NC, neocortex; Ce, cerebellum.
Figure 2.
In vivo detection of amyloid plaques in APP Tg mice at different ages. PET images were generated by averaging dynamic scan data at 30–60 min after administration of [11C]PIB and were overlaid on the MRI template. From left to right, panels represent coronal images at 0, 2, 3, and 7 mm posterior to the bregma. mo, Month.
Figure 3.
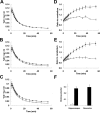
Association of regional radiotracer kinetics with brain amyloidosis in APP Tg mice. A–C, Time-radioactivity curves for the cerebellum (A), hippocampus (B), and neocortex (C) acquired from dynamic PET scans for 20- to 22-month-old APP Tg (filled circles; n = 11; age = 21.4 ± 0.30 months) and age-matched WT (open circles; n = 6; age = 21.7 ± 0.76 months) mice given injections of [11C]PIB. D, E, Target-to-cerebellum ratio of radioactivity in the hippocampus (D) and neocortex (E) at different time points. The ratio in Tg mice (filled circles) was progressively elevated toward 60 min after tracer administration, clearly contrasting with the near-steady state in WT mice (open circles) achieved from ∼15 min (significant main effects of time, region and genotype; time, F(17,255) = 55.2, p < 0.001; region, F(1,15) = 22.4, p < 0.001; genotype, F(1,15) = 13.5, p < 0.01; 2-way, repeated-measures ANOVA). F, Binding potential of the radioligand estimated by simplified reference tissue model. The tracer binding was pronouncedly increased in the hippocampus and neocortex of Tg mice (filled columns) compared with WT mice (open columns) (significant main effect of genotype; F(1,10) = 32.8; p < 0.001; 2-way, repeated-measures ANOVA). Error bars represent SE.
Figure 4.
Ability of mouse PET system to capture progressive amyloidosis during aging. A, B, Scatterplots of binding potential versus age in the hippocampus (A) and neocortex (B) of the Tg mice (total, 25 scans; age, 21.9 ± 0.62 months; range, 16.8–29.0 months), with the correlation of the two parameters being statistically significant in both regions (hippocampus, _R_2 = 0.79; neocortex, _R_2 = 0.79; p < 0.001, t test). Black lines represent regression, and red elements indicate longitudinal analysis of the same individuals (n = 5). C, D, Progression amyloid accumulation revealed by the substantial increase in tracer binding in the hippocampal formations of the same animal. PET images were generated by averaging dynamic scan data at 30–60 min after tracer injection and were merged onto the MRI template. mo, Month.
Figure 5.
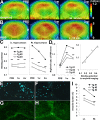
Amyloid elimination and glial activation during the course of anti-amyloid treatment as visualized by longitudinal PET scans. A, B, PET maps of [11C]PIB (A) and [18F]FE-DAA1106 (B) in a 20-month-old APP Tg mouse (Tg #3), generated by averaging dynamic data at 30–60 min (A) and 0–60 min (B), respectively, and superimposed on an MRI template. Images were obtained before (PRE; left), 1 week (1 w; middle), and 2 weeks (2 w; right) after passive Aβ immunization. Vehicle alone and anti-Aβ antibody were injected into the left and right hippocampi, respectively. L, Left; R, right. C, Time course of amyloid elimination quantified by multiple [11C]PIB PET scans during the course of anti-amyloid treatment. Binding potential in the vehicle-injected hippocampus remained unaltered (left; F(2,4) = 0.02 and p > 0.05 for main effect of time by repeated-measures ANOVA), whereas it was significantly reduced in the anti-Aβ antibody-injected hippocampus (right; F(2,4) = 7.56 and p < 0.05 for main effect of time by repeated-measures ANOVA). D, Ratio between [18F]FE-DAA1106 radioactivities (at 0–60 min after the radiotracer administration) in antibody- and vehicle-injected hippocampi, showing a markedly elevated neuroinflammatory response triggered by antibody injection (left; F(2,4) = 16.7 and p < 0.05 for main effect of time by repeated-measures ANOVA) and a close correlation between levels of neuroinflammation and amyloid at 1 and 2 weeks after treatment (right; _R_2 = 0.942; p < 0.01, t test). The solid line represents regression. E–H, Double fluorescence labeling of amyloid (FSB; E, F) and microglia (Iba-1; G, H) in the left (E, G) and right (F, H) hippocampi of a Tg mouse (Tg #1) at 2 weeks after immunization. I, Load of FSB-positive amyloid in the hippocampus, indicating a significant left–right difference (p < 0.05, t test). Horizontal bars in graphs represent mean values. Lt., Left; Rt., right.
Figure 6.
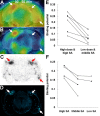
Contribution of specific radioactivity (SA) and ID of the radioligand to sensitive in vivo detection of amyloid plaques in APP Tg mice. A, PET image of a 20-month-old Tg mouse at 30–60 min after administration of [11C]PIB with high SA (∼200 GBq/μmol) and high dose (∼37 MBq). The image was overlaid on the MRI template. Intense spots were found in the bilateral medial hippocampi and right entorhinal cortex (arrows). B, Merged PET and MR image of the same mouse acquired after administration of the tracer with middle SA (∼20 GBq/μmol) and low dose (∼3.7 MBq). C, D, Ex vivo autoradiography using the same mouse showing tracer localization at 30 min after administration (C) and subsequent fluorescence staining of the autoradiographic sample using nonradioactive BTA-1 (D). Arrows indicate clusters of amyloid lesions corresponding to intense spots in A. E, Comparison of binding potential in the hippocampus (filled circles) and neocortex (open circles) of three Tg mice determined by PET scans with high-SA (∼200 GBq/μmol), high-dose (∼30 MBq) and middle-SA (∼20 GBq/μmol), low-dose (∼3 MBq) tracers. F, Comparison of binding potential in the hippocampus (filled circles) and neocortex (open circles) of two Tg mice obtained from PET data with high-SA (∼200 GBq/μmol), middle-SA (∼20 GBq/μmol), and low-SA (∼0.2 GBq/μmol) tracers. The injected dose of the tracer was ∼30 MBq in all measurements. Data from the same individuals in the graphs are connected by solid lines.
Figure 7.
Association between in vitro radiolabeling of amyloid with [11C]PIB and abundance of Aβ40 and Aβ42. Brain sections from the AD patient (A–D), 23-month-old APP23 mouse (E–H), 23-month-old Tg2576 mouse (I–L), and 8-month-old PS-1/APP double-Tg mouse (M–P) were used for autoradiography with [11C]PIB (low-power and high-power autoradiograms are shown in the first and second columns from the left, respectively), and thereafter doubly immunostained for Aβ40 (red in the third column) and Aβ42 (green in the third column) with polyclonal anti-Aβ40 and monoclonal anti-Aβ42 antibodies. Colocalization of radiolabeling with Aβ40 and Aβ42 was assessed by merging autoradiograms with immunohistochemical data (shown in the fourth column). Similar double-immunofluorescence staining was obtained by using monoclonal anti-Aβ40 and polyclonal anti-Aβ42 antibodies (data not shown). Red squares indicate areas shown in magnified images.
Figure 8.
Search for Aβ subtypes accumulating in close relation to [11C]PIB binding sites. A–T, Association between in vitro radiolabeling of amyloid with [11C]PIB and N-terminal truncation/modification of Aβ. Brain sections from the AD patient (A–E), 23-month-old APP23 mouse (F–J), 23-month-old Tg2576 mouse (K–O), and 8-month-old PS-1/APP double-Tg mouse (P–T) were used for autoradiography with [11C]PIB (low-power and high-power autoradiograms are shown in the first and second columns from the left, respectively), and thereafter immunostained with polyclonal anti-AβN3(pE) antibody (third column). Colocalization of radiolabeling with AβN3(pE) deposition was assessed by merging autoradiograms with immunohistochemical data (fourth column). Subadjacent sections were also immunolabeled with anti-AβN1D antibody (fifth column). Red squares indicate areas shown in magnified images. U–W, Association of in vitro [11C]PIB radiolabeling (normalized by intensity of nonspecific labeling) with areas occupied by Aβ40 (U, open symbols), Aβ42 (U, filled symbols), AβN1(pE) (V), and AβN1D (W) immunolabeling in the cortex of the AD patient (diamonds) and APP23 (squares), Tg2576 (triangles), and PS-1/APP double-Tg (circles) mice. The intensity of [11C]PIB signals was significantly correlated with AβN3(pE) labeling (p < 0.001, _t_ test), but not with the loads of other Aβ species (_p_ > 0.05, t test). Solid lines represent regression for Aβ42 (U), AβN1(pE) (V), and AβN1D (W), and the dashed line in U represents regression for Aβ40.


