Real-time imaging of discrete exocytic events mediating surface delivery of AMPA receptors - PubMed (original) (raw)
Comparative Study
Real-time imaging of discrete exocytic events mediating surface delivery of AMPA receptors
Guillermo A Yudowski et al. J Neurosci. 2007.
Abstract
We directly resolved discrete exocytic fusion events mediating insertion of AMPA-type glutamate receptors (AMPARs) to the somatodendritic surface of rat hippocampal pyramidal neurons, in slice and dissociated cultures, using protein tagging with a pH-sensitive GFP (green fluorescent protein) variant and rapid (10 frames/s) fluorescence microscopy. AMPAR-containing exocytic events occurred under basal culture conditions in both the cell body and dendrites; potentiating chemical stimuli produced an NMDA receptor-dependent increase in the frequency of individual exocytic events. The number of AMPARs inserted per exocytic event, estimated using single-molecule analysis, was quite uniform but individual events differed significantly in kinetic properties affecting the subsequent surface distribution of receptors. "Transient" events, from which AMPARs dispersed laterally immediately after surface insertion, generated a pronounced but short-lived (dissipating within approximately 1 s) increase in surface AMPAR fluorescence extending locally (2-5 microm) from the site of exocytosis. "Persistent" events, from which inserted AMPARs dispersed slowly (typically over 5-10 s), affected local surface receptor concentration to a much smaller degree. Both modes of exocytic insertion occurred throughout the dendritic shaft, but remarkably, neither mode of insertion was observed directly into synaptic spines. AMPARs entered spines preferentially from transient events occurring in the adjoining dendritic shaft, driven apparently by mass action and short-range lateral diffusion, and locally delivered AMPARs remained mostly in the mobile fraction. These results suggest a highly dynamic mechanism for both constitutive and activity-dependent surface delivery of AMPARs, mediated by kinetically distinct exocytic modes that differ in propensity to drive lateral entry of receptors to nearby synapses.
Figures
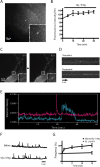
Figure 1.
Detection of SEP-AMPAR puffs in cultured hippocampal slices. A, Representative low magnification view of SEP-AMPAR fluorescence visualized in area CA1 of a cultured hippocampal slice 5 d after biolistic transfection; the inset shows a transfected pyramidal neuron. B, Effect of Gly/0 Mg on steady-state SEP-AMPAR fluorescence integrated over a single neuron. The graph shows change relative to initial value (before Gly/0 Mg application). Mean values were calculated across multiple experiments (n = 6); error bars represent SEM. C, Rapid imaging at higher magnification of SEP-AMPAR fluorescence in a field containing a neuronal cell body and proximal dendrites. Sequential 100 ms frames show an SEP-AMPAR insertion event (boxed area; the inset shows this region in greater detail). D, Representative kymographs illustrating the distinct kinetic properties of transient and persistent SEP-AMPAR events. E, Time course of SEP-AMPAR surface fluorescence intensity of representative transient and persistent events. F, Representative maximum intensity plot before (top) and immediately after (bottom) Gly/0 Mg manipulation. G, The squares and solid line indicate cumulative frequency analysis of SEP-AMPAR events imaged during sequential 1 min intervals surrounding the indicated time points after Gly/0 Mg manipulation. Frequencies are normalized to t = 0, the time interval immediately before magnesium depletion (n = 5). The triangles and solid line represent the same analysis conducted on cultures to which 50 μ
m
APV was added 10 min before t = 0 (n = 5). Error bars represent SEM.
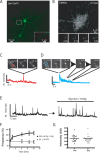
Figure 2.
Resolution of discrete SEP-AMPAR exocytic events in dissociated pyramidal neurons. A, Low-magnification view of SEP-AMPAR localization in a representative dissociated rat hippocampal neuron imaged using wide-field epifluorescence microscopy. The inset shows a portion of a dendrite at higher magnification. B, Maximum projection image generated from a 60 s time series of sequential 100 ms TIR-FM images of a neuronal cell body, in which individual SEP-AMPAR insertions appear as bright spots. The inset shows sequential 100 ms TIR-FM images of the boxed area (10 × 10 μm). C, Example of a transient SEP-AMPAR insertion event observed in the dendrite; sequential 100 ms frames are shown, with the maximum intensity plot of the field plotted below. D, Example of a persistent insertion event in a dendrite, with frames selected at the indicated time points after initial appearance of SEP-AMPAR fluorescence. E, Representative maximum intensity plot before (left) and after (right) depletion of magnesium from the culture medium. F, The squares and solid line indicate cumulative frequency analysis of SEP-AMPAR insertion events imaged during sequential 1 min intervals surrounding the indicated time points after Gly/0 Mg manipulation. Frequencies are normalized to t = 0, the time interval immediately before magnesium depletion (n = 6 experiments representing 207 insertion events). The triangles and dotted line represent the same analysis conducted on cultures to which 50 μ
m
APV was added 10 min before t = 0 (n = 4 experiments representing 147 insertion events; error bars represent SEM; *p < 0.05). G, Analysis of SEP-AMPAR insertion event peak fluorescence intensity in a representative field before (pre) and after Gly/0 Mg manipulation.
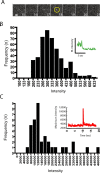
Figure 3.
Estimation of the number of SEP-AMPARs delivered to the plasma membrane by individual exocytic events. A, Sequential 300 ms exposures from a representative field of surface-adsorbed EGFP imaged by TIR-FM, showing single-step photobleaching characteristic of individual molecules in the field. B, Binned and background-subtracted intensity measurements of single EGFP molecules, compiled over multiple examples (n = 442) and normalized to 100 ms integration time (as described in Materials and Methods), yielded a mean single-molecule fluorescence intensity of 328 arbitrary units. The inset displays an example of an individual intensity trace showing single-step photobleaching. C, Binned and background-subtracted intensity measurements of SEP-AMPAR fluorescence intensities measured under the same conditions from 36 discrete exocytic events. The inset shows a representative intensity trace of a single event included in the distribution. The mean value of this distribution (1.69 × 10⁴ arbitrary fluorescence units) yielded an estimate of ∼51 labeled subunits inserted per exocytic event.
Figure 4.
Localization of SEP-AMPAR exocytic events relative to the postsynaptic density. Wide-field image of SEP-AMPAR fluorescence (white) imaged in a region of a dendrite of a living pyramidal neuron in dissociated culture (top panels), and the same image overlaid with the localization of endogenous PSD-95 (displayed in red) determined by post hoc immunolabeling of neurons after chemical fixation (bottom panels). Selected 100 ms frames are displayed from a sequential image series, showing the initial image of the dendritic region (left), a transient exocytic event (middle), and a persistent exocytic event (right). The scale bar is in the bottom left, and the time stamp (in seconds) is in the bottom right. The entire kinetic series is included as supplemental movie 5 (available at
as supplemental material).
Figure 5.
Lateral dispersion of SEP-AMPARs from individual exocytic events in the dendritic shaft. A, Locally increased surface fluorescence produced by dispersion of inserted SEP-AMPARs in the dendritic shaft. B, Time course of maximal and integrated surface SEP-AMPAR fluorescence intensity from the dendritic field shown. Maximal intensity refers to the maximum pixel value in the field at the indicated time; integrated intensity refers to the fluorescence intensity summed over all pixels in the field shown. C, Sequential 100 ms image series showing dispersion of inserted SEP-AMPARs on the dendritic shaft and spread onto the surface of a nearby spine. Background-subtracted fluorescence intensities are displayed using the color scale indicated in the left panel. D, Example of a single SEP-AMPAR insertion event (red circle) occurring in the local neighborhood of two opposing spines located near the site of insertion (green and blue circles). E, Maximum intensity values over time of surface SEP-AMPAR fluorescence in the regions indicated in C. F, Quantification of SEP-AMPAR fluorescence imaged on randomly selected spines after an individual insertion event occurring <5 μm away on the dendritic shaft, where lateral spread of inserted SEP-AMPARs on the shaft domain immediately adjoining the spine was clearly evident. Data were collected from 51 separate insertion events occurring on different dendrites and in multiple neurons (n = 5), and binned according to whether (squares) or not (triangles) a detectable increase in surface SEP-AMPAR fluorescence was observed on the spine. Points represent mean change in maximum SEP-AMPAR intensity on the spine, averaged over the indicated 1 s intervals, relative to that measured on the spine 1 s before the initial appearance of the local SEP-AMPAR insertion event (t = 0 corresponds to the time at which the SEP-AMPAR insertion event was first detected; *p < 0.05). Error bars represent SEM.
Similar articles
- AMPA receptor incorporation into synapses during LTP: the role of lateral movement and exocytosis.
Makino H, Malinow R. Makino H, et al. Neuron. 2009 Nov 12;64(3):381-90. doi: 10.1016/j.neuron.2009.08.035. Neuron. 2009. PMID: 19914186 Free PMC article. - MAP1B Light Chain Modulates Synaptic Transmission via AMPA Receptor Intracellular Trapping.
Palenzuela R, Gutiérrez Y, Draffin JE, Lario A, Benoist M, Esteban JA. Palenzuela R, et al. J Neurosci. 2017 Oct 11;37(41):9945-9963. doi: 10.1523/JNEUROSCI.0505-17.2017. Epub 2017 Sep 13. J Neurosci. 2017. PMID: 28904092 Free PMC article. - Photochemical inactivation analysis of temporal dynamics of postsynaptic native AMPA receptors in hippocampal slices.
Kamiya H. Kamiya H. J Neurosci. 2012 May 9;32(19):6517-24. doi: 10.1523/JNEUROSCI.0720-12.2012. J Neurosci. 2012. PMID: 22573674 Free PMC article. - The dendritic SNARE fusion machinery involved in AMPARs insertion during long-term potentiation.
Jurado S. Jurado S. Front Cell Neurosci. 2014 Dec 22;8:407. doi: 10.3389/fncel.2014.00407. eCollection 2014. Front Cell Neurosci. 2014. PMID: 25565955 Free PMC article. Review. - AMPA Receptor Trafficking for Postsynaptic Potentiation.
Park M. Park M. Front Cell Neurosci. 2018 Oct 11;12:361. doi: 10.3389/fncel.2018.00361. eCollection 2018. Front Cell Neurosci. 2018. PMID: 30364291 Free PMC article. Review.
Cited by
- Cadherin-based transsynaptic networks in establishing and modifying neural connectivity.
Friedman LG, Benson DL, Huntley GW. Friedman LG, et al. Curr Top Dev Biol. 2015;112:415-65. doi: 10.1016/bs.ctdb.2014.11.025. Epub 2015 Feb 11. Curr Top Dev Biol. 2015. PMID: 25733148 Free PMC article. Review. - Studying signal transduction in single dendritic spines.
Yasuda R. Yasuda R. Cold Spring Harb Perspect Biol. 2012 Oct 1;4(10):a005611. doi: 10.1101/cshperspect.a005611. Cold Spring Harb Perspect Biol. 2012. PMID: 22843821 Free PMC article. Review. - Rapid delivery of internalized signaling receptors to the somatodendritic surface by sequence-specific local insertion.
Yu YJ, Dhavan R, Chevalier MW, Yudowski GA, von Zastrow M. Yu YJ, et al. J Neurosci. 2010 Sep 1;30(35):11703-14. doi: 10.1523/JNEUROSCI.6282-09.2010. J Neurosci. 2010. PMID: 20810891 Free PMC article. - Non-synaptic receptors and transporters involved in brain functions and targets of drug treatment.
Vizi ES, Fekete A, Karoly R, Mike A. Vizi ES, et al. Br J Pharmacol. 2010 Jun;160(4):785-809. doi: 10.1111/j.1476-5381.2009.00624.x. Epub 2010 Feb 5. Br J Pharmacol. 2010. PMID: 20136842 Free PMC article. Review. - Primary cilia and dendritic spines: different but similar signaling compartments.
Nechipurenko IV, Doroquez DB, Sengupta P. Nechipurenko IV, et al. Mol Cells. 2013 Oct;36(4):288-303. doi: 10.1007/s10059-013-0246-z. Epub 2013 Sep 16. Mol Cells. 2013. PMID: 24048681 Free PMC article. Review.
References
- Adesnik H, Nicoll RA, England PM. Photoinactivation of native AMPA receptors reveals their real-time trafficking. Neuron. 2005;48:977–985. - PubMed
- Bats C, Groc L, Choquet D. The interaction between Stargazin and PSD-95 regulates AMPA receptor surface trafficking. Neuron. 2007;53:719–734. - PubMed
- Beattie EC, Carroll RC, Yu X, Morishita W, Yasuda H, von Zastrow M, Malenka RC. Regulation of AMPA receptor endocytosis by a signaling mechanism shared with LTD. Nat Neurosci. 2000;3:1291–1300. - PubMed
- Beattie EC, Stellwagen D, Morishita W, Bresnahan JC, Ha BK, Von Zastrow M, Beattie MS, Malenka RC. Control of synaptic strength by glial TNFalpha. Science. 2002;295:2282–2285. - PubMed
Publication types
MeSH terms
Substances
Grants and funding
- R37 DA010711/DA/NIDA NIH HHS/United States
- R01 MH067931/MH/NIMH NIH HHS/United States
- K99 DA023444/DA/NIDA NIH HHS/United States
- R29 DA010711/DA/NIDA NIH HHS/United States
- DA010711/DA/NIDA NIH HHS/United States
- R01 DA010711/DA/NIDA NIH HHS/United States
- MH067931/MH/NIMH NIH HHS/United States
- K99 DA023444-02/DA/NIDA NIH HHS/United States
LinkOut - more resources
Full Text Sources
Other Literature Sources


