Adverse effect of cyclosporin A on barrier functions of cerebral microvascular endothelial cells after hypoxia-reoxygenation damage in vitro - PubMed (original) (raw)
Adverse effect of cyclosporin A on barrier functions of cerebral microvascular endothelial cells after hypoxia-reoxygenation damage in vitro
Shinya Dohgu et al. Cell Mol Neurobiol. 2007 Nov.
Abstract
Hypoxia and post-hypoxic reoxygenation induces disruption of the blood-brain barrier (BBB). Alterations of the BBB function after hypoxia/reoxygenation (H/R) injury remain unclear. Cyclosporin A (CsA), a potent immunosuppressant, induces neurotoxic effects by entering the brain, although the transport of CsA across the BBB is restricted by P-glycoprotein (P-gp), a multidrug efflux pump, and tight junctions of the brain capillary endothelial cells. The aim of this study was to evaluate whether the BBB after H/R damage is vulnerable to CsA-induced BBB dysfunction. We attempted to establish a pathophysiological BBB model with immortalized mouse brain capillary endothelial (MBEC4) cells. The effects of CsA on permeability and P-gp activity of the MBEC4 cells were then examined. Exposure to hypoxia for 4 h and reoxygenation for 1 h (H/R (4 h/1 h)) produced a significant decrease in P-gp function of MBEC4 cells, without changing cell viability and permeability for sodium fluorescein and Evan's blue-albumin at 7 days after H/R (4 h/1 h). CsA-induced hyperpermeability and P-gp dysfunction in MBEC4 monolayers at 7 days after H/R (4 h/1 h) were exacerbated. The possibility that CsA penetrates the BBB with incomplete functions in the vicinity of cerebral infarcts to induce neurotoxicity has to be considered.
Figures
Fig. 1
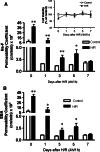
Time course of Na-F (A) and EBA (B) permeability in MBEC4 monolayers after exposure to H/R (4 h/1 h). Permeability studies were performed at 0, 1, 3, 5, and 7 days after H/R (4 h/1 h). Values are means ± SEM (n = 11–15). *P < 0.05, **P < 0.01, significantly different from controls. The inset in panel A shows the time course of cell viability in MBEC4 monolayers after H/R (4 h/1 h). Results are expressed as percentage of cell viability in the control monolayer. Values are means ± SEM (n = 9–15)
Fig. 2
Rhodamine 123 accumulation in MBEC4 cells after H/R damage. P-gp function was evaluated at 7 days after H/R (4 h/1 h). Results are expressed as percentage of controls (0.67 ± 0.18 nmol/mg protein). Protein concentrations of the control and H/R-treated MBEC4 cells were 0.34 ± 0.02 mg and 0.30 ± 0.02 mg, respectively. Values are means ± SEM (n = 12). **P < 0.01, significantly different from control MBEC4 cells
Fig. 3
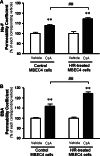
Effects of CsA on Na-F (A) and EBA (B) permeability in MBEC4 monolayers after H/R damage. MBEC4 cells were cultured with normal medium for 7 days after H/R (4 h/1 h). Permeability studies were performed after exposure to CsA (5 μM) for 12 h. Permeability coefficients of Na-F in each vehicle-treated group were 1.91 ± 0.10 × 10⁻⁴ and 1.94 ± 0.11 × 10⁻⁴ cm/min for control and H/R-treated MBEC4 cells, respectively. Permeability coefficients of EBA for each corresponding vehicle-treated group were 0.50 ± 0.03 × 10⁻⁴ and 0.52 ± 0.04 × 10⁻⁴ cm/min for control and H/R-treated MBEC4 cells, respectively. Results are expressed as percentage of each corresponding vehicle-treated group. Values are means ± SEM (n = 11–12). **P < 0.01, significantly different from each corresponding vehicle group. (##P < 0.01; significant difference between control and H/R-treated MBEC4 cells, when exposed to CsA
Fig. 4
Effect of CsA on rhodamine 123 accumulation in MBEC4 cells after H/R damage. MBEC4 cells were cultured with normal medium for 7 days after H/R (4 h/1 h). P-gp function was evaluated after exposure to CsA (2 and 5 μM) for 12 h. Results are expressed as percentage of each corresponding vehicle (control MBEC4 cells, 2.72 ± 0.38 nmol/mg protein and H/R-treated MBEC4 cells, 2.41 ± 0.34 nmol/mg protein). Protein concentrations of the control MBEC4 cells after treatment with vehicle, CsA 2 μM and 5 μM were 0.05 ± 0.01 mg, 0.07 ± 0.01 mg, and 0.07 ± 0.01 mg, respectively. Protein concentrations of the H/R treated MBEC4 cells after treatment with vehicle, CsA 2 μM and 5 μM were 0.07 ± 0.01 mg, 0.07 ± 0.01 mg, and 0.06 ± 0.01 mg, respectively. Values are means ± SEM (n = 14–16). *P < 0.05, **P < 0.01, significant difference from each corresponding vehicle. (##P < 0.01; significant difference between control and H/R-treated MBEC4 cells, when exposed to CsA (2 μM). ††P < 0.01; significant difference between control and H/R-treated MBEC4 cells when exposed to CsA (5 μM)
Similar articles
- Protective action of indapamide, a thiazide-like diuretic, on ischemia-induced injury and barrier dysfunction in mouse brain microvascular endothelial cells.
Nishioku T, Takata F, Yamauchi A, Sumi N, Yamamoto I, Fujino A, Naito M, Tsuruo T, Shuto H, Kataoka Y. Nishioku T, et al. J Pharmacol Sci. 2007 Mar;103(3):323-7. doi: 10.1254/jphs.sc0060222. Epub 2007 Mar 2. J Pharmacol Sci. 2007. PMID: 17332692 - Cyclosporin A induces hyperpermeability of the blood-brain barrier by inhibiting autocrine adrenomedullin-mediated up-regulation of endothelial barrier function.
Dohgu S, Sumi N, Nishioku T, Takata F, Watanabe T, Naito M, Shuto H, Yamauchi A, Kataoka Y. Dohgu S, et al. Eur J Pharmacol. 2010 Oct 10;644(1-3):5-9. doi: 10.1016/j.ejphar.2010.05.035. Epub 2010 Jun 8. Eur J Pharmacol. 2010. PMID: 20553921 - Transforming growth factor-beta1 upregulates the tight junction and P-glycoprotein of brain microvascular endothelial cells.
Dohgu S, Yamauchi A, Takata F, Naito M, Tsuruo T, Higuchi S, Sawada Y, Kataoka Y. Dohgu S, et al. Cell Mol Neurobiol. 2004 Jun;24(3):491-7. doi: 10.1023/b:cemn.0000022776.47302.ce. Cell Mol Neurobiol. 2004. PMID: 15206827 Free PMC article. - Potential Regulation Mechanisms of P-gp in the Blood-Brain Barrier in Hypoxia.
Ding Y, Wang R, Zhang J, Zhao A, Lu H, Li W, Wang C, Yuan X. Ding Y, et al. Curr Pharm Des. 2019;25(10):1041-1051. doi: 10.2174/1381612825666190610140153. Curr Pharm Des. 2019. PMID: 31187705 Review. - Permeability studies on in vitro blood-brain barrier models: physiology, pathology, and pharmacology.
Deli MA, Abrahám CS, Kataoka Y, Niwa M. Deli MA, et al. Cell Mol Neurobiol. 2005 Feb;25(1):59-127. doi: 10.1007/s10571-004-1377-8. Cell Mol Neurobiol. 2005. PMID: 15962509 Free PMC article. Review.
Cited by
- Experimental models for assaying microvascular endothelial cell pathophysiology in stroke.
Camós S, Mallolas J. Camós S, et al. Molecules. 2010 Dec 10;15(12):9104-34. doi: 10.3390/molecules15129104. Molecules. 2010. PMID: 21150829 Free PMC article. Review. - Tissue plasminogen activator enhances the hypoxia/reoxygenation-induced impairment of the blood-brain barrier in a primary culture of rat brain endothelial cells.
Hiu T, Nakagawa S, Hayashi K, Kitagawa N, Tsutsumi K, Kawakubo J, Honda M, Suyama K, Nagata I, Niwa M. Hiu T, et al. Cell Mol Neurobiol. 2008 Dec;28(8):1139-46. doi: 10.1007/s10571-008-9294-x. Epub 2008 Jul 16. Cell Mol Neurobiol. 2008. PMID: 18629628 Free PMC article. - Differential microRNA profiling in a cellular hypoxia reoxygenation model upon posthypoxic propofol treatment reveals alterations in autophagy signaling network.
Chen Z, Hu Z, Lu Z, Cai S, Gu X, Zhuang H, Ruan Z, Xia Z, Irwin MG, Feng D, Zhang L. Chen Z, et al. Oxid Med Cell Longev. 2013;2013:378484. doi: 10.1155/2013/378484. Epub 2013 Dec 22. Oxid Med Cell Longev. 2013. PMID: 24454982 Free PMC article. - iPS Cell Differentiation into Brain Microvascular Endothelial Cells.
Medina A, Tang H. Medina A, et al. Methods Mol Biol. 2022;2429:201-213. doi: 10.1007/978-1-0716-1979-7_13. Methods Mol Biol. 2022. PMID: 35507163 Free PMC article. - Role of pericyte-derived SENP1 in neuronal injury after brain ischemia.
Sun M, Chen X, Yin YX, Gao Y, Zhang L, Chen B, Ji Y, Fukunaga K, Han F, Lu YM. Sun M, et al. CNS Neurosci Ther. 2020 Aug;26(8):815-828. doi: 10.1111/cns.13398. Epub 2020 Jun 4. CNS Neurosci Ther. 2020. PMID: 32495523 Free PMC article.
References
- Abbruscato TJ, Davis TP (1999) Combination of hypoxia/aglycemia compromises in vitro blood-brain barrier integrity. J Pharmacol Exp Ther 289:668–675 - PubMed
- Brillault J, Berezowski V, Cecchelli R, Dehouck MP (2002) Intercommunications between brain capillary endothelial cells and glial cells increase the transcellular permeability of the blood-brain barrier during ischemia. J Neurochem 83:807–817 - PubMed
- de Groen PC, Aksamit AJ, Rakela J, Forbes GS, Krom RAF (1987) Central nerves system toxicity after liver transplantation. N Engl J Med 317:861–866 - PubMed
- Dehouck MP, Jolliet-Riant P, Brée F, Fruchart JC, Cecchelli R, Tillement J-P (1992) Drug transfer across the blood-brain barrier: correlation between in vitro and in vivo models. J Neurochem 58:1790–1797 - PubMed
- Dimitrijevic OB, Stamatovic SM, Keep RF, Andjelkovic AV (2007) Absence of the chemokine receptor CCR2 protects against cerebral ischemia/reperfusion injury in mice. Stroke 38:1345–1353 - PubMed
Publication types
MeSH terms
Substances
LinkOut - more resources
Full Text Sources
Other Literature Sources
Miscellaneous


