Mitochondrial dysfunction due to long-chain Acyl-CoA dehydrogenase deficiency causes hepatic steatosis and hepatic insulin resistance - PubMed (original) (raw)
Mitochondrial dysfunction due to long-chain Acyl-CoA dehydrogenase deficiency causes hepatic steatosis and hepatic insulin resistance
Dongyan Zhang et al. Proc Natl Acad Sci U S A. 2007.
Abstract
Alterations in mitochondrial function have been implicated in the pathogenesis of insulin resistance and type 2 diabetes. However, it is unclear whether the reduced mitochondrial function is a primary or acquired defect in this process. To determine whether primary defects in mitochondrial beta-oxidation can cause insulin resistance, we studied mice with a deficiency of long-chain acyl-CoA dehydrogenase (LCAD), a key enzyme in mitochondrial fatty acid oxidation. Here, we show that LCAD knockout mice develop hepatic steatosis, which is associated with hepatic insulin resistance, as reflected by reduced insulin suppression of hepatic glucose production during a hyperinsulinemic-euglycemic clamp. The defects in insulin action were associated with an approximately 40% reduction in insulin-stimulated insulin receptor substrate-2-associated phosphatidylinositol 3-kinase activity and an approximately 50% decrease in Akt2 activation. These changes were associated with increased PKCepsilon activity and an aberrant 4-fold increase in diacylglycerol content after insulin stimulation. The increase in diacylglycerol concentration was found to be caused by de novo synthesis of diacylglycerol from medium-chain acyl-CoA after insulin stimulation. These data demonstrate that primary defects in mitochondrial fatty acid oxidation capacity can lead to diacylglycerol accumulation, PKCepsilon activation, and hepatic insulin resistance.
Conflict of interest statement
The authors declare no conflict of interest.
Figures
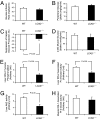
Fig. 1.
Whole-body glucose metabolism and insulin signaling in WT (open bars) and _LCAD_−/− (filled bars) mice during the hyperinsulinemic-euglycemic clamp. (A) Glucose infusion rate averaged for the last 30 min of the clamp. (B) Whole-body glucose disposal rate during the clamp. (C) Suppression of hepatic glucose production during the clamp. (D) Rate of insulin-stimulated muscle glucose uptake. (E) Liver IRS2 tyrosine phosphorylation. (F) Liver PI3-kinase activity. (G) Liver Akt2 activity. (H) Muscle IRS-1-associated PI3-kinase activity.
Fig. 2.
Hepatic insulin resistance in _LCAD_−/− mice is associated with increased insulin-stimulated diacylglycerol content and PKCε membrane translocation. (A) Liver diacylglycerol content at basal fasting condition. (B) Liver diacylglycerol content after the hyperinsulinemic-euglycemic clamp. (C) Western blot analysis of basal liver cytosolic and membranal PKCε. (D) Western blot analysis of cytosolic and membranal PKCε in livers of mice after clamp.
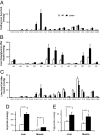
Fig. 3.
Profile and contents of acyl-CoA, diacylglycerol and triglyceride in liver and muscle. (A) Liver fasting acyl-CoA profile. (B) Liver diacylglycerol profile after insulin clamp. A, E, S, O, L, and P denote arachidonoyl, eicosa pentanoyl, stearoyl, oleoyl, linoleoyl, and palmitoyl groups, respectively. (C) Acyl-CoA profile after insulin clamp. (D) Acyl-CoA content. (E) Triglyceride content.
Fig. 4.
Schematic diagram of oleic acid metabolism in liver of WT and _LCAD_−/− mice. (A) During fasting, WT mice have high mitochondrial oleic acid oxidation and relatively lower peroxisomal and microsomal fatty acid oxidation. (B) During fasting, _LCAD_−/− mice have reduced mitochondrial oleic acid oxidation at the level of 5-tetradecenoyl-CoA, which accumulates and is partially oxidized by peroxisomal and microsomal oxidation. (C) Fed WT mice convert extra oleic acid to triglyceride. (D) Fed _LCAD_−/− mice convert the accumulated 5-tetradecenoyl-CoA to diacylglycerol. ER, endoplasmic reticulum; ACS, acyl-CoA synthetase; VLCAD, very long chain acyl-CoA dehydrogenase; AOX, acyl-CoA oxidase; TG, triglyceride; DAG, diacylglyerol; LPA, lysophosphatidic acid; DGAT, diacylglycerol acyl transferase; AGPAT, acylglycerol phosphate acyl transferase; GPAT, glycerol phosphate acyl transferase.
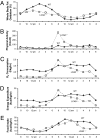
Fig. 5.
Indirect calorimetry measurement during a 24-h period. (A) Percentage of whole-body fatty acid oxidation (derived from the measured value of respiratory quotient). (B) Physical activity. (C) Energy expenditure. (D) Oxygen consumption. (E) Food intake.
Similar articles
- Prevention of hepatic steatosis and hepatic insulin resistance in mitochondrial acyl-CoA:glycerol-sn-3-phosphate acyltransferase 1 knockout mice.
Neschen S, Morino K, Hammond LE, Zhang D, Liu ZX, Romanelli AJ, Cline GW, Pongratz RL, Zhang XM, Choi CS, Coleman RA, Shulman GI. Neschen S, et al. Cell Metab. 2005 Jul;2(1):55-65. doi: 10.1016/j.cmet.2005.06.006. Cell Metab. 2005. PMID: 16054099 - Resistance to high-fat diet-induced obesity and insulin resistance in mice with very long-chain acyl-CoA dehydrogenase deficiency.
Zhang D, Christianson J, Liu ZX, Tian L, Choi CS, Neschen S, Dong J, Wood PA, Shulman GI. Zhang D, et al. Cell Metab. 2010 May 5;11(5):402-11. doi: 10.1016/j.cmet.2010.03.012. Cell Metab. 2010. PMID: 20444420 Free PMC article. - Deficiency in the short-chain acyl-CoA dehydrogenase protects mice against diet-induced obesity and insulin resistance.
Chen Y, Chen J, Zhang C, Yang S, Zhang X, Liu Y, Su Z. Chen Y, et al. FASEB J. 2019 Dec;33(12):13722-13733. doi: 10.1096/fj.201901474RR. Epub 2019 Oct 4. FASEB J. 2019. PMID: 31585505 - Malonyl CoA, long chain fatty acyl CoA and insulin resistance in skeletal muscle.
Ruderman NB, Dean D. Ruderman NB, et al. J Basic Clin Physiol Pharmacol. 1998;9(2-4):295-308. doi: 10.1515/jbcpp.1998.9.2-4.295. J Basic Clin Physiol Pharmacol. 1998. PMID: 10212840 Review. - Diacylglycerol activation of protein kinase Cε and hepatic insulin resistance.
Jornayvaz FR, Shulman GI. Jornayvaz FR, et al. Cell Metab. 2012 May 2;15(5):574-84. doi: 10.1016/j.cmet.2012.03.005. Cell Metab. 2012. PMID: 22560210 Free PMC article. Review.
Cited by
- Nonalcoholic Fatty Liver Disease and Staging of Hepatic Fibrosis.
Engin A. Engin A. Adv Exp Med Biol. 2024;1460:539-574. doi: 10.1007/978-3-031-63657-8_18. Adv Exp Med Biol. 2024. PMID: 39287864 Review. - Structural basis for expanded substrate specificities of human long chain acyl-CoA dehydrogenase and related acyl-CoA dehydrogenases.
Narayanan B, Xia C, McAndrew R, Shen AL, Kim JP. Narayanan B, et al. Sci Rep. 2024 Jun 5;14(1):12976. doi: 10.1038/s41598-024-63027-6. Sci Rep. 2024. PMID: 38839792 Free PMC article. - Transcriptomic analysis identifies the shared diagnostic biomarkers and immune relationship between Atherosclerosis and abdominal aortic aneurysm based on fatty acid metabolism gene set.
Gu X, Yu Z, Qian T, Jin Y, Xu G, Li J, Gu J, Li M, Tao K. Gu X, et al. Front Mol Biosci. 2024 Apr 10;11:1365447. doi: 10.3389/fmolb.2024.1365447. eCollection 2024. Front Mol Biosci. 2024. PMID: 38660376 Free PMC article. - Stealthy progression of type 2 diabetes mellitus due to impaired ketone production in an adult patient with multiple acyl-CoA dehydrogenase deficiency.
Ikeda N, Wada Y, Izumi T, Munakata Y, Katagiri H, Kure S. Ikeda N, et al. Mol Genet Metab Rep. 2024 Jan 26;38:101061. doi: 10.1016/j.ymgmr.2024.101061. eCollection 2024 Mar. Mol Genet Metab Rep. 2024. PMID: 38469101 Free PMC article. - Structural Basis for Expanded Substrate Specificities of Human Long Chain Acyl-CoA Dehydrogenase and Related Acyl- CoA Dehydrogenases.
Narayanan B, Xia C, McAndrew R, Shen AL, Kim JP. Narayanan B, et al. Res Sq [Preprint]. 2024 Feb 29:rs.3.rs-3980524. doi: 10.21203/rs.3.rs-3980524/v1. Res Sq. 2024. PMID: 38464032 Free PMC article. Updated. Preprint.
References
- Mootha VK, Bunkenborg J, Olsen JV, Hjerrild M, Wisniewski JR, Stahl E, Bolouri MS, Ray HN, Sihag S, Kamal M, et al. Cell. 2003;115:629–640. - PubMed
- Kelly DP, Scarpulla RC. Genes Dev. 2004;18:357–368. - PubMed
Publication types
MeSH terms
Substances
Grants and funding
- R01 RR002599/RR/NCRR NIH HHS/United States
- U24 DK 59635/DK/NIDDK NIH HHS/United States
- U24 DK059635/DK/NIDDK NIH HHS/United States
- R01 DK040936/DK/NIDDK NIH HHS/United States
- R01 DK 40936/DK/NIDDK NIH HHS/United States
- R01 RR 02599/RR/NCRR NIH HHS/United States
LinkOut - more resources
Full Text Sources
Other Literature Sources
Molecular Biology Databases
Miscellaneous


