A gene regulatory network in mouse embryonic stem cells - PubMed (original) (raw)
A gene regulatory network in mouse embryonic stem cells
Qing Zhou et al. Proc Natl Acad Sci U S A. 2007.
Abstract
We analyze new and existing expression and transcription factor-binding data to characterize gene regulatory relations in mouse ES cells (ESC). In addition to confirming the key roles of Oct4, Sox2, and Nanog, our analysis identifies several genes, such as Esrrb, Stat3, Tcf7, Sall4, and LRH-1, as statistically significant coregulators. The regulatory interactions among 15 core regulators are used to construct a gene regulatory network in ESC. The network encapsulates extensive cross-regulations among the core regulators, highlights how they may control epigenetic processes, and reveals the surprising roles of nuclear receptors. Our analysis also provides information on the regulation of a large number of putative target genes of the network.
Conflict of interest statement
The authors declare no conflict of interest.
Figures
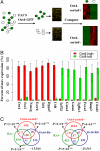
Fig. 1.
Overview of the Oct4-sorted series. (A) FACS in an ESC to EB differentiation time course followed by expression profiling. The cells were separated by FACS into undifferentiated (GFP+) and differentiated (GFP−) subpopulations, as indicated by green and white solid circles, respectively. Microarray expression profiling was performed on the sorted subpopulations of cells, and we used the resulting data as the basis for identifying Oct4-sorted± genes. (B) Expression levels of selected marker genes in the Oct4-high and -low samples as measured by the percentage of maximal expression. The error bars indicate the standard errors of the expression levels. (C) Overlaps between the gene sets in the Oct4-sorted, Oct4-RNAi, and RA-induction series. The numbers in the Venn diagrams represent the counts of the contiguous regions (gene sets) where they appear. The P values of the overlaps are calculated by the hypergeometric distribution (
SI Text
).
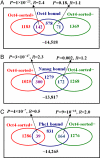
Fig. 2.
The overlaps between Oct4-sorted± genes and Oct4-bound (A), Nanog-bound (B), and Phc1-bound (C) genes. The statistical significance (P value) is calculated on the basis of the hypergeometric distribution, and the enrichment level R is defined as the ratio of the number of observed overlaps over that of expected overlaps. The computations of the P value and enrichment level are explained in
SI Text
.
Fig. 3.
A regulatory network in mouse ESC anchored on the master regulators Oct4, Sox2, and Nanog. The network represents the interactions among the core regulators (pink) and their protein-interaction partners (yellow). Blue and pink arrows indicate regulatory interactions inferred by anchor sites and by sites of coregulators within 150 bp of the anchor sites, respectively. Orange and green lines represent protein interactions identified in ref. and reported in the literature, respectively. Arrows from a dashed ellipse indicate that the targets are regulated by all of the regulators inside the ellipse. Some regulators appear multiple times in the network to reduce the number of intersecting arrows.
Similar articles
- Genome-wide analysis reveals Sall4 to be a major regulator of pluripotency in murine-embryonic stem cells.
Yang J, Chai L, Fowles TC, Alipio Z, Xu D, Fink LM, Ward DC, Ma Y. Yang J, et al. Proc Natl Acad Sci U S A. 2008 Dec 16;105(50):19756-61. doi: 10.1073/pnas.0809321105. Epub 2008 Dec 5. Proc Natl Acad Sci U S A. 2008. PMID: 19060217 Free PMC article. - Tcf3 is an integral component of the core regulatory circuitry of embryonic stem cells.
Cole MF, Johnstone SE, Newman JJ, Kagey MH, Young RA. Cole MF, et al. Genes Dev. 2008 Mar 15;22(6):746-55. doi: 10.1101/gad.1642408. Genes Dev. 2008. PMID: 18347094 Free PMC article. - Pluripotency governed by Sox2 via regulation of Oct3/4 expression in mouse embryonic stem cells.
Masui S, Nakatake Y, Toyooka Y, Shimosato D, Yagi R, Takahashi K, Okochi H, Okuda A, Matoba R, Sharov AA, Ko MS, Niwa H. Masui S, et al. Nat Cell Biol. 2007 Jun;9(6):625-35. doi: 10.1038/ncb1589. Epub 2007 May 21. Nat Cell Biol. 2007. PMID: 17515932 - Networks of Transcription Factors for Oct4 Expression in Mice.
Li YQ. Li YQ. DNA Cell Biol. 2017 Sep;36(9):725-736. doi: 10.1089/dna.2017.3780. Epub 2017 Jul 21. DNA Cell Biol. 2017. PMID: 28731785 Review. - Pluripotency and Epigenetic Factors in Mouse Embryonic Stem Cell Fate Regulation.
Morey L, Santanach A, Di Croce L. Morey L, et al. Mol Cell Biol. 2015 Aug;35(16):2716-28. doi: 10.1128/MCB.00266-15. Epub 2015 Jun 1. Mol Cell Biol. 2015. PMID: 26031336 Free PMC article. Review.
Cited by
- Approaches for Benchmarking Single-Cell Gene Regulatory Network Methods.
Karamveer, Uzun Y. Karamveer, et al. Bioinform Biol Insights. 2024 Nov 4;18:11779322241287120. doi: 10.1177/11779322241287120. eCollection 2024. Bioinform Biol Insights. 2024. PMID: 39502448 Free PMC article. Review. - An Oct4-Sall4-Nanog network controls developmental progression in the pre-implantation mouse embryo.
Tan MH, Au KF, Leong DE, Foygel K, Wong WH, Yao MW. Tan MH, et al. Mol Syst Biol. 2013;9:632. doi: 10.1038/msb.2012.65. Mol Syst Biol. 2013. PMID: 23295861 Free PMC article. - The B-MYB transcriptional network guides cell cycle progression and fate decisions to sustain self-renewal and the identity of pluripotent stem cells.
Zhan M, Riordon DR, Yan B, Tarasova YS, Bruweleit S, Tarasov KV, Li RA, Wersto RP, Boheler KR. Zhan M, et al. PLoS One. 2012;7(8):e42350. doi: 10.1371/journal.pone.0042350. Epub 2012 Aug 24. PLoS One. 2012. PMID: 22936984 Free PMC article. - Constitutive Stat3 activation alters behavior of hair follicle stem and progenitor cell populations.
Rao D, Macias E, Carbajal S, Kiguchi K, DiGiovanni J. Rao D, et al. Mol Carcinog. 2015 Feb;54(2):121-33. doi: 10.1002/mc.22080. Epub 2013 Sep 4. Mol Carcinog. 2015. PMID: 24038534 Free PMC article. - ReXSpecies--a tool for the analysis of the evolution of gene regulation across species.
Struckmann S, Araúzo-Bravo MJ, Schöler HR, Reinbold RA, Fuellen G. Struckmann S, et al. BMC Evol Biol. 2008 Apr 14;8:111. doi: 10.1186/1471-2148-8-111. BMC Evol Biol. 2008. PMID: 18410675 Free PMC article.
References
- Chambers I, Smith A. Oncogene. 2004;23:7150–7160. - PubMed
- Ivanova N, Dobrin R, Lu R, Kotenko I, Levorse J, DeCoste C, Schafer X, Lun Y, Lemischka I. Nature. 2006;442:533–538. - PubMed
Publication types
MeSH terms
Substances
LinkOut - more resources
Full Text Sources
Other Literature Sources
Research Materials
Miscellaneous


