Ca2+-binding proteins tune Ca2+-feedback to Cav1.3 channels in mouse auditory hair cells - PubMed (original) (raw)
Ca2+-binding proteins tune Ca2+-feedback to Cav1.3 channels in mouse auditory hair cells
Guiying Cui et al. J Physiol. 2007.
Abstract
Sound coding at the auditory inner hair cell synapse requires graded changes in neurotransmitter release, triggered by sustained activation of presynaptic Ca(v)1.3 voltage-gated Ca(2+) channels. Central to their role in this regard, Ca(v)1.3 channels in inner hair cells show little Ca(2+)-dependent inactivation, a fast negative feedback regulation by incoming Ca(2+) ions, which depends on calmodulin association with the Ca(2+) channel alpha(1) subunit. Ca(2+)-dependent inactivation characterizes nearly all voltage-gated Ca(2+) channels including Ca(v)1.3 in other excitable cells. The mechanism underlying the limited autoregulation of Ca(v)1.3 in inner hair cells remains a mystery. Previously, we established calmodulin-like Ca(2+)-binding proteins in the brain and retina (CaBPs) as essential modulators of voltage-gated Ca(2+) channels. Here, we demonstrate that CaBPs differentially modify Ca(2+) feedback to Ca(v)1.3 channels in transfected cells and explore their significance for Ca(v)1.3 regulation in inner hair cells. Of multiple CaBPs detected in inner hair cells (CaBP1, CaBP2, CaBP4 and CaBP5), CaBP1 most efficiently blunts Ca(2+)-dependent inactivation of Ca(v)1.3. CaBP1 and CaBP4 both interact with calmodulin-binding sequences in Ca(v)1.3, but CaBP4 more weakly inhibits Ca(2+)-dependent inactivation than CaBP1. Ca(2+)-dependent inactivation is marginally greater in inner hair cells from CaBP4(-/-) than from wild-type mice, yet CaBP4(-/-) mice are not hearing-impaired. In contrast to CaBP4, CaBP1 is strongly localized at the presynaptic ribbon synapse of adult inner hair cells both in wild-type and CaBP4(-/-) mice and therefore is positioned to modulate native Ca(v)1.3 channels. Our results reveal unexpected diversity in the strengths of CaBPs as Ca(2+) channel modulators, and implicate CaBP1 rather than CaBP4 in conferring the anomalous slow inactivation of Ca(v)1.3 Ca(2+) currents required for auditory transmission.
Figures
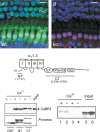
Figure 1. CaBP4 is localized in IHCs and functionally interacts with Cav1.3
A, immunofluorescence of CaBP4 in the organ of Corti from WT (A) and CaBP4−/− (B) mice. Projections of confocal sections show immunofluorescence for CaBP4 (green) and CtBP2/RIBEYE (red) in IHCs and OHCs. Hoechst staining (blue) marks cell nuclei. Scale bars, 10 μm. Results shown are representative of at least 2 experiments performed with 6 organs of Corti. C, schematic diagram of Cav1.3 α1 subunit indicating CT and NT fragments used for binding assays with CaBP4. D, CaBP4 pull-down with GST-tagged CT or NT. GST or GST-CT or NT was immobilized on glutathione beads and incubated with lysates from HEK293T cells transfected with CaBP4 in the presence (+) or absence of (−) of Ca2+. Bound CaBP4 was detected by Western blot with CaBP4 antibodies (top). Input represents ∼5% of protein used in assay. Ponceau staining shows levels of GST proteins used in assay. Results shown are representative of 3 experiments. E, co-immunoprecipitation of CaBP4 with Cav1.3. HEK293T cells were transfected with Cav1.3 + CaBP4 (lanes 1, 2, 5) or with CaBP4 alone (lanes 3, 4, 6), lysed, and subjected to immunoprecipitation with Cav1.3 antibodies with (+) or without (−) Ca2+. Input represents ∼5% of lysate used for assay. Co-immunoprecipitated CaBP4 was detected by Western blot with CaBP4 antibodies. Results shown are representative of three experiments.
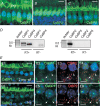
Figure 5. CaBP1, 2, and 5 are localized in IHCs
A_–_C, confocal micrographs of whole-mount preparations of mouse organ of Corti (P14–P15) labelled with antibodies against CaBP1 (A), CaBP2 (B), or CaBP5 (C) and FITC-secondary antibodies (green) followed by Hoechst staining of nuclei (blue). Images represent single (A), or projections of, confocal section(s) (B and C). CaBP1 staining was detected in IHC soma and overlying pillar cells (PC). Scale bars, 10 μm. Results shown are representative of experiments performed with at least 6 organs of Corti. D, RT-PCR analysis of CaBP variants in mouse cochlear extracts. Reactions were performed with (+RT) or without reverse transcriptase (−RT) as a negative control. E, presynaptic localization of CaBP1 in IHCs from 2-month-old WT and CaBP4−/− (KO) IHCs. Confocal micrographs show whole-mounts of organs of Corti double labelled with antibodies against CaBP1 (green, E1, 2, 5, 6) and CtBP2 (red, E3, E7). Examples of colocalization are indicated with arrows and appear yellow in the merged images (E4, 8). Scale bars, 10 μm in E1, E2; 5 μm in E2−4, E6 −8. Results shown are representative of experiments performed with 4 organs of Corti.
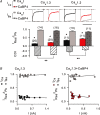
Figure 2. aBP4 is a weak modulator of Cav CDI
A, inhibitory effect of CaBP4 on CDI of Cav1.3 and Cav1.2. Ca2+ or Ba2+ currents (_I_Ca, _I_Ba) were recorded in HEK293T cells transfected with Cav1.3 (α11.3, β2a, α2δ) or Cav1.2 (α11.2, β2a, α2δ) alone or cotransfected with CaBP4. Test pulses were 300 ms steps from −90 to −20 mV for Cav1.3 or 1 s steps from −80 to −10 mV for Cav1.2. Inactivation was measured as _I_res/_I_pk, which was the residual current amplitude at the end of the pulse normalized to the peak current amplitude. CDI is the difference in _I_res/_I_pk for _I_Ca and _I_Ba. Representative current traces for _I_Ca (black or red) and _I_Ba (grey) are shown. *P < 0.01 compared to _I_Ba by t test; **P < 0.005 compared to Cav1.3 or Cav1.2 alone, by ANOVA and post hoc Bonferroni t test. Number of cells in each group indicated in parentheses. Scale bar, 0.2 s for Cav1.3 and Cav1.3 + CaBP4; 0.65 s for Cav1.2. Representative current traces are shown above. Scale bar, 800 ms for Cav1.2, 250 ms for Cav1.3. B, current independence of Cav1.3 inactivation. _I_res/_I_pk for cells obtained in A was plotted against peak current amplitude for _I_Ca and _I_Ba in cells transfected with Cav1.3 alone (left) or cotransfected with CaBP4 (right). Each point represents _I_res/_I_pk for a single cell. Data were linear as determined by Run's test, with regression line indicated. For both Cav1.3 alone and Cav1.3 + CaBP4, the slopes of the regression line did not differ significantly from zero (for Cav1.3 alone, P = 0.08 for _I_Ca, P = 0.28 for _I_Ba; for Cav1.3 + CaBP4, P = 0.58 for _I_Ca, P = 0.29 for _I_Ba; by ANOVA).
Figure 3. Weak modulation by CaBP4 is independent of Cavβ subunit
_I_res/_I_pk was determined for I_Ca as in Fig. 2_A in cells cotransfected with Cav1.3 (α11.3, β, α2δ) alone or cotransfected with CaBP4. Inhibition of inactivation by CaBP4 was measured as Δ_I_CaBP4=[(_I_res/_I_pk for Cav1.3) − (_I_res/_I_pk for Cav1.3 + CaBP4)]/(_I_res/_I_pk for Cav1.3). *P < 0.02 compared to Cav1.3 alone by t test. Representative current traces are shown above. Scale bar, 250 ms. Number of cells indicated in parentheses.
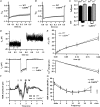
Figure 4. Hearing is not impaired in CaBP4 knockout mice
A and B, mean _I_Ca (A) and _I_Ba (B) of WT (black, n = 12) and CaBP4−/− (grey, n = 14) IHCs evoked by 500 ms depolarizations to −16 mV. Currents were normalized to their peak amplitude and displayed with standard errors. C, _I_res/I_pk and CDI were determined as in Fig. 2_A except that currents were evoked as in (A and B) and residual current amplitude was measured at 300 ms. D, representative _I_Ca and baseline-subtracted _C_m traces (200 ms step to −16 mV). E, grand average of Δ_C_m (top) and _I_Ca integrals (bottom) plotted against pulse duration for WT (n = 25) and CaBP4 −/− (n = 7) IHCs. F, grand average of ABR evoked by suprathreshold clicks (80 dB) in WT (black) and CaBP4−/− mice (grey). Roman numerals denominate the individual ABR peaks arising from the neurons of the ascending auditory pathway. G, ABR audiograms of WT (black) and CaBP4−/− mice (grey) obtained by tone burst and click stimulation.
Figure 6. CaBP1 causes robust suppression of _I_Ca inactivation compared to other CaBP variants
Distinct effects of CaBP1, 2, 4 and 5 on inactivation of Cav1.3 in transfected HEK293T cells. Measurements of _I_Ca, _I_res/_I_pk, and Δ_I_CaBP were as in Fig. 3 for cells transfected with Cav1.3 (α11.3, β2a, α2δ) alone or cotransfected with CaBP1, 2, 4, or 5. *P < 0.02 compared to Cav1.3 alone by t test. **P < 0.001 compared to CaBP4 by ANOVA and post hoc t test. Number of cells indicated in parentheses.
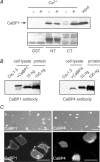
Figure 7. CaBP1 binds to same sites in α11.3, but shows stronger expression levels and cell-surface targeting compared to CaBP4
A, CaBP1 pull-down with GST-tagged CT or NT performed in the presence (+) or absence (−) of Ca2+ as in Fig. 1_D_. Results shown are representative of 3 experiments. B, Western blot of lysates from cells used for electrophysiological recording shows decreased levels of CaBP4 compared to CaBP1 in cells cotransfected with Cav1.3. Lanes 1 and 2 represent lysates of cells transfected with Cav1.3 alone (lane 1) or cotransfected with CaBP (lane 2). Lanes 3 and 4 contain purified GST-tagged CaBP1 (left panel) or His-tagged CaBP4 (right panel) at the indicated quantities. Western blotting was with CaBP1 or CaBP4 antibodies. Results shown are representative of 3 experiments. C, confocal micrographs of GFP-tagged CaBP1 or CaBP4 cotransfected with Cav1.3 as for electrophysiological experiments. Top panels show fluorescence images overlaying DIC image (scale bars, 50 μm). Higher magnification views in lower panels reveal GFP fluorescence restricted to the plasma membrane of cells cotransfected with GFP-CaBP1 (left) as compared to diffuse localization of GFP-CaBP4 (scale bars, 20 μm). Results shown are representative of 3 experiments.
Figure 8. Mutation of the IQ domain in α11.3 inhibits CDI and binding of CaBP1 and CaBP4
A, effect of I-E mutation on CDI. HEK293T cells were transfected with wild-type Cav1.3 or channels containing α11.3 with I-E substitution in IQ domain (+β1b, α2δ). Same analysis as in Fig. 2_A_ for CDI. *P < 0.001 compared to I_Ba; **P < 0.001 compared to Cav1.3; by t test. Number of cells indicated in parentheses. B, effect of I-E mutation on CaBP binding. Pull-down of CaBP1 or CaBP4 by GST, CT, or CT containing I-E mutation was performed as in Fig. 7_A. Results shown are representative of 3 experiments.
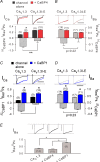
Figure 9. I-E mutation in α11.3 blocks effects of CaBP4 but partially spares modulation by CaBP1
A and B, loss of CaBP4 effects on inactivation of Cav1.3I-E. HEK293T cells were cotransfected with CaBP4 and Cav1.3 or Cav1.3I-E (α11.3 or α11.3I-E, β1b, α2δ). Same analysis as in Fig. 3 for inactivation of _I_Ca (A) and _I_Ba (B). By t test, *P < 0.02 compared to Cav1.3 alone; **P < 0.001 compared to Cav1.3. C and D, effects of CaBP1 on inactivation are partially spared in Cav1.3I-E. Cells were cotransfected with CaBP1 and Cav1.3 or Cav1.3I-E (α11.3 or α11.3I-E, β1b, α2δ). Same analysis as in C. *P < 0.01, **P < 0.0001 compared to Cav1.3, by t test. In A_–_D, scale bars, 200 ms. E, decreased VDI of _I_Ba in cells cotransfected with CaBP1 but not CaBP1. _I_Ba was evoked by 1 s pulses from −90 mV to −20 mV in cells transfected with Cav1.3 alone, +CaBP4, or +CaBP1. *P < 0.001 by ANOVA and post hoc Bonferroni test. Vertical scale bars, 0.2 nA. In A–E, number of cells is indicated in parentheses.
Comment in
- C-terminal tailoring of L-type calcium channel function.
Striessnig J. Striessnig J. J Physiol. 2007 Dec 15;585(Pt 3):643-4. doi: 10.1113/jphysiol.2007.147140. J Physiol. 2007. PMID: 18084049 Free PMC article. No abstract available.
Similar articles
- Decalmodulation of Cav1 channels by CaBPs.
Hardie J, Lee A. Hardie J, et al. Channels (Austin). 2016;10(1):33-7. doi: 10.1080/19336950.2015.1051273. Epub 2015 Jul 8. Channels (Austin). 2016. PMID: 26155893 Free PMC article. Review. - Ca2+-binding protein 2 inhibits Ca2+-channel inactivation in mouse inner hair cells.
Picher MM, Gehrt A, Meese S, Ivanovic A, Predoehl F, Jung S, Schrauwen I, Dragonetti AG, Colombo R, Van Camp G, Strenzke N, Moser T. Picher MM, et al. Proc Natl Acad Sci U S A. 2017 Feb 28;114(9):E1717-E1726. doi: 10.1073/pnas.1617533114. Epub 2017 Feb 9. Proc Natl Acad Sci U S A. 2017. PMID: 28183797 Free PMC article. - Expression and Localization of CaBP Ca2+ Binding Proteins in the Mouse Cochlea.
Yang T, Scholl ES, Pan N, Fritzsch B, Haeseleer F, Lee A. Yang T, et al. PLoS One. 2016 Jan 25;11(1):e0147495. doi: 10.1371/journal.pone.0147495. eCollection 2016. PLoS One. 2016. PMID: 26809054 Free PMC article. - CaBP1 and 2 enable sustained CaV1.3 calcium currents and synaptic transmission in inner hair cells.
Oestreicher D, Chepurwar S, Kusch K, Rankovic V, Jung S, Strenzke N, Pangrsic T. Oestreicher D, et al. Elife. 2024 Dec 24;13:RP93646. doi: 10.7554/eLife.93646. Elife. 2024. PMID: 39718549 Free PMC article. - L-Type Ca2+ Channel Regulation by Calmodulin and CaBP1.
Ames JB. Ames JB. Biomolecules. 2021 Dec 2;11(12):1811. doi: 10.3390/biom11121811. Biomolecules. 2021. PMID: 34944455 Free PMC article. Review.
Cited by
- Decalmodulation of Cav1 channels by CaBPs.
Hardie J, Lee A. Hardie J, et al. Channels (Austin). 2016;10(1):33-7. doi: 10.1080/19336950.2015.1051273. Epub 2015 Jul 8. Channels (Austin). 2016. PMID: 26155893 Free PMC article. Review. - Voltage-gated calcium channels.
Catterall WA. Catterall WA. Cold Spring Harb Perspect Biol. 2011 Aug 1;3(8):a003947. doi: 10.1101/cshperspect.a003947. Cold Spring Harb Perspect Biol. 2011. PMID: 21746798 Free PMC article. Review. - Calcium binding protein-mediated regulation of voltage-gated calcium channels linked to human diseases.
Nejatbakhsh N, Feng ZP. Nejatbakhsh N, et al. Acta Pharmacol Sin. 2011 Jun;32(6):741-8. doi: 10.1038/aps.2011.64. Acta Pharmacol Sin. 2011. PMID: 21642945 Free PMC article. Review. - Calcium Sensors in Neuronal Function and Dysfunction.
Burgoyne RD, Helassa N, McCue HV, Haynes LP. Burgoyne RD, et al. Cold Spring Harb Perspect Biol. 2019 May 1;11(5):a035154. doi: 10.1101/cshperspect.a035154. Cold Spring Harb Perspect Biol. 2019. PMID: 30833454 Free PMC article. Review. - Bioinformatic analysis of CaBP/calneuron proteins reveals a family of highly conserved vertebrate Ca2+-binding proteins.
McCue HV, Haynes LP, Burgoyne RD. McCue HV, et al. BMC Res Notes. 2010 Apr 28;3:118. doi: 10.1186/1756-0500-3-118. BMC Res Notes. 2010. PMID: 20426809 Free PMC article.
References
Publication types
MeSH terms
Substances
Grants and funding
- R03 EY014561/EY/NEI NIH HHS/United States
- NS 044922/NS/NINDS NIH HHS/United States
- DC 008417/DC/NIDCD NIH HHS/United States
- R03 DC008417/DC/NIDCD NIH HHS/United States
- EY 014561/EY/NEI NIH HHS/United States
- R01 NS044922/NS/NINDS NIH HHS/United States
LinkOut - more resources
Full Text Sources
Molecular Biology Databases
Miscellaneous
