Decay accelerating factor can control T cell differentiation into IFN-gamma-producing effector cells via regulating local C5a-induced IL-12 production - PubMed (original) (raw)
Decay accelerating factor can control T cell differentiation into IFN-gamma-producing effector cells via regulating local C5a-induced IL-12 production
Peter N Lalli et al. J Immunol. 2007.
Abstract
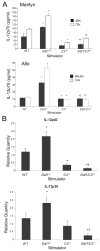
A newly recognized link between the complement system and adaptive immunity is that decay accelerating factor (DAF), a cell surface C3/C5 convertase regulator, exerts control over T cell responses. Extending these results, we show that cultures of Marilyn TCR-transgenic T cells stimulated with DAF-deficient (Daf1(-/-)) APCs produce significantly more IL-12, C5a, and IFN-gamma compared with cultures containing wild-type APCs. DAF-regulated IL-12 production and subsequent T cell differentiation into IFN-gamma-producing effectors was prevented by the deficiency of either C3 or C5a receptor (C5aR) in the APC, demonstrating a link between DAF, local complement activation, IL-12, and T cell-produced IFN-gamma. Bone marrow chimera experiments verified that bone marrow cell-expressed C5aR is required for optimal differentiation into IFN-gamma-producing effector T cells. Overall, our results indicate that APC-expressed DAF regulates local production/activation of C5a following cognate T cell/APC interactions. Through binding to its receptor on APCs the C5a up-regulates IL-12 production, this in turn, contributes to directing T cell differentiation toward an IFN-gamma-producing phenotype. The findings have implications for design of therapies aimed at altering pathologic T cell immunity.
Conflict of interest statement
Disclosures
The authors have no financial conflict of interest.
Figures
FIGURE 1
APC-expressed DAF regulates C3-dependent IL-12 production. A, Top, Concentration of IL-12p70 in supernatants of Mar T cells stimulated with Dby peptide-loaded WT, _Daf1_−/−, _C3_−/−, and _Daf1/C3_−/− peritoneal macrophage at 48 and 72 h. Results represent mean plus SD of three individual experiments. Bottom, Concentration of IL-12p70 in supernatants of BALB/c or C3H T cells stimulated with B6 WT, _Daf1_−/−, _C3_−/−, and _Daf1/C3_−/− spleen cell APCs at 72 h. No cytokines were detected in wells containing T cells alone, APCs alone, or mixtures of syngeneic T cells plus APCs (data not shown). *, p < 0.05 vs WT; †, p < 0.01 vs _Daf1_−/−. B, Relative quantification of mRNA for IL-12p40 (top) and p35 (bottom) in whole culture lysates of Mar T cells stimulated with Dby peptide-loaded WT, _Daf1_−/−, _C3_−/−, and _Daf1/C3_−/− peritoneal macrophage at 72 h. Data are normalized to WT APCs before stimulation. Results represent mean plus SE of at least two experiments for each group. *, p < 0.05 vs WT; †, p < 0.01 vs _Daf1_−/−.
FIGURE 2
APC-expressed DAF regulates C3-dependent T cell cytokine production. A, Left, Cytokines detected in 72 h (IFN-γ) or 48 h (IL-2/IL-4) culture supernatants of Mar T cells stimulated with WT, _Daf1_−/−, or _C3_−/− peritoneal macrophages. Right, Cytokines detected in 72 h culture supernatants of BALB/c or C3H T cells stimulated with B6 WT, _Daf1_−/−, or _C3_−/− spleen cell APCs. B, IFN-γ production by CFSE-labeled Mar T cells stimulated with WT, _Daf1_−/−, or _C3_−/− peritoneal macrophage. Representative flow plots from 3-day cultures (B) are depicted. Numbers in upper left quadrant represent percent IFN-γ+ T cells undergoing more than one division. C and D, In vivo effects of DAF on T cell IFN-γ production. Percentages of IFN-γ+ Mar T cells in the spleens (C) and the total numbers of Mar T cells in the spleens (D) 60 h after injection into WT, _Daf1_−/−, or _C3_−/− male mice (10 × 106 cells/mouse). Horizontal bars represent mean values for each group; n = 4/group. *, p < 0.05 vs WT.
FIGURE 3
DAF regulation of T cell IFN-γ production is dependent on APC-expressed IL-12 and T cell expressed IL-12R. A, IFN-γ detected in 72-h culture supernatants of Mar T cells mixed with WT, _Daf1_−/−, or _Daf1/IL12p40_−/− APCs ± anti-12 mAb (25 _μ_g/ml blocking anti-IL-12 mAb) or rIL-12. *, p < 0.05 vs WT; †, p < 0.05 vs _Daf1_−/−. B, Representative flow plots of CFSE-labeled Mar T cells stimulated in vitro for 3 days with HY_Dby_-loaded WT, _Daf1_−/−, or _Daf1/IL-12_−/− peritoneal macrophages ±25 _μ_g/ml blocking anti-IL-12 mAb or control Ab and stained for intracellular IFN-γ. Upper plots, Single-color histograms for IFN-γ (% IFN-γ+ in each panel); lower panels, CFSE dilution of responding T cells (the average number of cell divisions is shown in each panel, n = 2–3/group). Representative of more than three individual experiments per condition are shown. C, Flow cytometry plots of CFSE-labeled WT or _IL-12Rβ1_−/− Mar T cells stimulated with WT or _Daf1_−/− APCs in vitro on day 3. Upper plots, Single-color histograms for IFN-γ; lower panels, CFSE dilution of responding T cells. Percentages of IFN-γ+ cells or average number of cell divisions for each plot are shown. Representative of more than three individual experiments are shown. D, Percentages of IFN-γ+ WT or _IL-12Rβ1_−/− Mar T cells in recipient spleens at 60 h after injection into male WT, _Daf1_−/−, _IL-12p40_−/−, or _Daf1/IL-12p40_−/− recipients. Data represent mean values for groups plus SD n = 4/group. *, p < 0.05 vs WT T cells; †, p < 0.05 vs WT APCs; ‡, p < 0.05 vs _Daf1_−/− APCs.
FIGURE 4
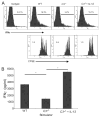
Diminished production of IFN-γ by T cells stimulated with _C3_−/− APCs is overcome by exogenous IL-12. A, Flow cytometry plots of CFSE-labeled WT Mar T cells stimulated with WT or _C3_−/− APCs for 3 days in the presence or absence of 10 ng/ml rIL-12 and stained for intra-cellular IFN-γ. Upper plots, Single-color histograms for IFN-γ; lower panels, CFSE dilution of responding T cells. Percentages of IFN-γ+ cells or average number of cell divisions for each plot are shown. Representative of more than three individual experiments are shown. B, IFN-γ in 72-h culture supernatants of Mar T cells responding to WT or _C3_−/− APC with or without 10 ng/ml rIL-12. Results are representative of two individual experiments. *, p < 0.05 vs WT.
FIGURE 5
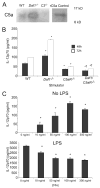
C5a is produced by cognate interactions and promotes production of APC IL-12. A, Western blot of culture supernatants for C5a from cultures of Mar T cells with male WT, _Daf1_−/−, and _C3_−/−APCs. rC5a is shown as a positive control. B, IL-12p70 ELISA of culture supernatants taken from cultures of Mar T cells stimulated with WT, _Daf1_−/−, _C5aR_−/−, or _Daf1/C5aR_−/− APCs at 48 and 72 h. Results represent mean plus SD of duplicate wells of two individual experiments. *, p < 0.05 vs WT; †, p < 0.01 vs _Daf1_−/−. C, IL-12p70 protein in supernatants of unstimulated (top) or LPS stimulated (bottom, 10 ng/ml LPS) WT APCs in the presence of increasing concentrations of rC5a as determined by ELISA. No IL-12p70 was detected after stimulation of _C5aR_−/− macrophages with the same concentrations of C5a (data not shown). Data represents mean plus SD for each group. *, p < 0.05 vs no C5a control.
FIGURE 6
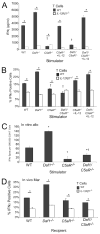
APC-expressed C5aR is required for optimal effector T cell production of IFN-γ. A, IFN-γ detected in 72-h culture supernatants of WT Mar T cells (■) or IL-12R−/− Mar T cells (□) 3 days after stimulation with WT, _Daf1_−/−, _C5aR_−/−, or _Daf1/C5aR_−/− HY_Dby_-loaded APCs in the presence or absence of 10 ng/ml rIL-12. Data represent mean plus SD for each group. *, p < 0.05 vs WT T cells; †, p < 0.01 vs _Daf1_−/− APCs. B, Percentages of IFN-_γ_-producing WT (■) or _IL-12Rβ1_−/− (□) Mar T cells on day 3 of cultures with each APC type as depicted in the panel. C, IFN-γ ELISPOTs produced by WT polyclonal C3H (H-2k) T cells stimulated in vitro with WT, _Daf1_−/−, _C5aR_−/−, or _Daf1/C5aR_−/− (H-2b) splenocytes. Data represent mean plus SD for each group. *, p < 0.05 vs WT; †, p < 0.01 vs _Daf1_−/−. D, Percentages of IFN-_γ_-producing WT (■) or _IL-12Rβ1_−/− (□) Mar T cells 60 h after injection into WT, _Daf1_−/−, _C5aR_−/−, or _Daf1/C5aR_−/− male recipients. Data represent mean values for groups plus SD; n = 4/group. *, p < 0.05 vs WT T cells.
FIGURE 7
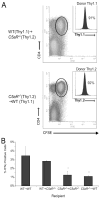
BM-derived cell expression of C5aR is required for optimal T cell IFN-γ production in vivo. A, Representative flow cytometry plots of CFSE-labeled CD4+ Mar T cells of Mar T cells injected into WT (Thy1.1)→_C5aR_−/− (Thy1.2) or _C5aR_−/− (Thy1.2)→WT (Thy1.1) BM chimeric mice. Chimerism was determined to be >90% donor BM based on Thy1.1/Thy1.2 polymorphisms (inset). B, Percentages of injected IFN-γ+ Mar T cells 72 h after injection into WT→WT, _C5aR_−/−→ _C5aR_−/−, WT→_C5aR_−/−, or _C5aR_−/−→ WT BM chimeric mice. Data represent mean values for groups plus SD; n = 3/group. *, p < 0.05 vs WT→WT.
Similar articles
- IFN-gamma and IL-17 production in experimental autoimmune encephalomyelitis depends on local APC-T cell complement production.
Liu J, Lin F, Strainic MG, An F, Miller RH, Altuntas CZ, Heeger PS, Tuohy VK, Medof ME. Liu J, et al. J Immunol. 2008 May 1;180(9):5882-9. doi: 10.4049/jimmunol.180.9.5882. J Immunol. 2008. PMID: 18424707 Free PMC article. - Locally produced C5a binds to T cell-expressed C5aR to enhance effector T-cell expansion by limiting antigen-induced apoptosis.
Lalli PN, Strainic MG, Yang M, Lin F, Medof ME, Heeger PS. Lalli PN, et al. Blood. 2008 Sep 1;112(5):1759-66. doi: 10.1182/blood-2008-04-151068. Epub 2008 Jun 20. Blood. 2008. PMID: 18567839 Free PMC article. - Primed CD8(+) T-cell responses to allogeneic endothelial cells are controlled by local complement activation.
Raedler H, Yang M, Lalli PN, Medof ME, Heeger PS. Raedler H, et al. Am J Transplant. 2009 Aug;9(8):1784-95. doi: 10.1111/j.1600-6143.2009.02723.x. Epub 2009 Jun 26. Am J Transplant. 2009. PMID: 19563342 - Complement modulation of T cell immune responses during homeostasis and disease.
Clarke EV, Tenner AJ. Clarke EV, et al. J Leukoc Biol. 2014 Nov;96(5):745-56. doi: 10.1189/jlb.3MR0214-109R. Epub 2014 Sep 10. J Leukoc Biol. 2014. PMID: 25210145 Free PMC article. Review. - Complement regulation of T cell immunity.
Kwan WH, van der Touw W, Heeger PS. Kwan WH, et al. Immunol Res. 2012 Dec;54(1-3):247-53. doi: 10.1007/s12026-012-8327-1. Immunol Res. 2012. PMID: 22477527 Free PMC article. Review.
Cited by
- Dynamic regulation of B cell complement signaling is integral to germinal center responses.
Cumpelik A, Heja D, Hu Y, Varano G, Ordikhani F, Roberto MP, He Z, Homann D, Lira SA, Dominguez-Sola D, Heeger PS. Cumpelik A, et al. Nat Immunol. 2021 Jun;22(6):757-768. doi: 10.1038/s41590-021-00926-0. Epub 2021 May 24. Nat Immunol. 2021. PMID: 34031614 Free PMC article. - Late stage definitive endodermal differentiation can be defined by Daf1 expression.
Ogaki S, Omori H, Morooka M, Shiraki N, Ishida S, Kume S. Ogaki S, et al. BMC Dev Biol. 2016 May 31;16(1):19. doi: 10.1186/s12861-016-0120-2. BMC Dev Biol. 2016. PMID: 27245320 Free PMC article. - Renal C3 complement component: feed forward to diabetic kidney disease.
Kelly KJ, Liu Y, Zhang J, Dominguez JH. Kelly KJ, et al. Am J Nephrol. 2015;41(1):48-56. doi: 10.1159/000371426. Epub 2015 Jan 30. Am J Nephrol. 2015. PMID: 25662584 Free PMC article. - NOD2-mediated suppression of CD55 on neutrophils enhances C5a generation during polymicrobial sepsis.
Oh SJ, Kim JH, Chung DH. Oh SJ, et al. PLoS Pathog. 2013 May;9(5):e1003351. doi: 10.1371/journal.ppat.1003351. Epub 2013 May 9. PLoS Pathog. 2013. PMID: 23675299 Free PMC article. - The complement inhibitor FUT-175 suppresses T cell autoreactivity in experimental autoimmune encephalomyelitis.
Li Q, Nacion K, Bu H, Lin F. Li Q, et al. Am J Pathol. 2009 Aug;175(2):661-7. doi: 10.2353/ajpath.2009.081093. Epub 2009 Jul 16. Am J Pathol. 2009. PMID: 19608865 Free PMC article.
References
- McHeyzer-Williams MG, Davis MM. Antigen-specific development of primary and memory T cells in vivo. Science. 1995;268:106–111. - PubMed
- Chakir H, Campos-Neto A, Mojibian M, Webb JR. IL-12Rβ2-deficient mice of a genetically resistant background are susceptible to Leishmania major infection and develop a parasite-specific Th2 immune response. Microbes Infect. 2003;5:241–249. - PubMed
- Mattner F, Magram J, Ferrante J, Launois P, Di Padova K, Behin R, Gately MK, Louis JA, Alber G. Genetically resistant mice lacking interleukin-12 are susceptible to infection with Leishmania major and mount a polarized Th2 cell response. Eur J Immunol. 1996;26:1553–1559. - PubMed
- Satoskar AR, Rodig S, Telford SR, 3rd, Satoskar AA, Ghosh SK, von Lichtenberg F, David JR. IL-12 gene-deficient C57BL/6 mice are susceptible to Leishmania donovani but have diminished hepatic immunopathology. Eur J Immunol. 2000;30:834–839. - PubMed
- Trinchieri G. Interleukin-12: a proinflammatory cytokine with immuno-regulatory functions that bridge innate resistance and antigen-specific adaptive immunity. Annu Rev Immunol. 1995;13:251–276. - PubMed
Publication types
MeSH terms
Substances
Grants and funding
- R01 AI071185/AI/NIAID NIH HHS/United States
- AI43578/AI/NIAID NIH HHS/United States
- R01 AI043578/AI/NIAID NIH HHS/United States
- R01 AI023598/AI/NIAID NIH HHS/United States
- R01 AI071185-02/AI/NIAID NIH HHS/United States
LinkOut - more resources
Full Text Sources
Molecular Biology Databases
Miscellaneous
