The Arabidopsis DESPERADO/AtWBC11 transporter is required for cutin and wax secretion - PubMed (original) (raw)
The Arabidopsis DESPERADO/AtWBC11 transporter is required for cutin and wax secretion
David Panikashvili et al. Plant Physiol. 2007 Dec.
Abstract
The cuticle fulfills multiple roles in the plant life cycle, including protection from environmental stresses and the regulation of organ fusion. It is largely composed of cutin, which consists of C(16-18) fatty acids. While cutin composition and biosynthesis have been studied, the export of cutin monomers out of the epidermis has remained elusive. Here, we show that DESPERADO (AtWBC11) (abbreviated DSO), encoding a plasma membrane-localized ATP-binding cassette transporter, is required for cutin transport to the extracellular matrix. The dso mutant exhibits an array of surface defects suggesting an abnormally functioning cuticle. This was accompanied by dramatic alterations in the levels of cutin monomers. Moreover, electron microscopy revealed unusual lipidic cytoplasmatic inclusions in epidermal cells, disappearance of the cuticle in postgenital fusion areas, and altered morphology of trichomes and pavement cells. We also found that DSO is induced by salt, abscisic acid, and wounding stresses and its loss of function results in plants that are highly susceptible to salt and display reduced root branching. Thus, DSO is not only essential for developmental plasticity but also plays a vital role in stress responses.
Figures
Figure 1.
The dso loss-of-function mutant phenotypes. A, Scheme of the DSO locus (At1g17840) depicting the RNAi target sequence in the second exon and T-DNA insertion located in the fifth exon of the dso-3 line. B, Inter-organ postgenital fusions in the dso-1 mutant plant. A fusion area between inflorescence and leaf is indicated by an arrow. C, Fusion between a leaf blade (lb) and a floral bud (fb) in dso-1. D, Fusion between two leaves of dso-2 plant. E, Unusual protrusions in dso-3 plants grown in tissue culture. F, A cer phenotype in dso-2 plant stem (left) versus wild-type (WT) stem (right). G and H, dso-1 (G) and the wild type (H), 1-month-old plants after 2-min immersion in toluidine blue staining solution. Sites of the dye penetration are indicated by arrows. I, A dso-2 flower phenotype. Underdeveloped petal is indicated by an arrow. J, Vasculature phenotype detected in dso-3 rosette leaf. K, Wild-type rosette leaf vasculature. L, Siliques of dso-3 (1), dso-2 (2), and the wild type (3). M, Leaf phenotype of a severe dso-2 mutant line (1), mild dso-2 mutant line (2), dso-3 (3), and the wild type (4). N, The cer5-1/dso-2 (mild) double mutant phenotype. Fusion between leaves is indicated by an arrow. Bars = 2 mm in B and 1 mm in C.
Figure 2.
SEM pictures. A and B, Stem wax load of dso-2 (A) and wild-type (B) plants. C, Occasional ruptures in the epidermis of dso-2. D, Distorted and underdeveloped trichomes of dso-3. E, Collapsed and underdeveloped trichome of dso-1. Misshapen support cells are indicated by an arrow. F, A wild-type trichome. G, Abnormal anther filament of a dso-3 flower. H, Curved petals of a dso-3 flower. I and J, Light microscopy images showing aberrant pavement cell pattern and abnormal stomatal cells (indicated by arrows) in dso-3 (I) and abaxial leaf epidermis of wild-type plants (J). K and L, SEM of abnormal conical cells in the abaxial epidermis of a dso-3 flower petal (K) and conical cells in the abaxial epidermis of a wild-type flower petal (L). M and N, SEM micrographs of shriveled pollen grains in dso-3 lines (M) and pollen grains in the wild type (N). O and P, Stigmata papillae of dso-3 (O) and those of the wild type (P); grains could not be detected in dso-3. Bars = 20 _μ_m in C and 50 _μ_m in I and J.
Figure 3.
The dso mutants exhibit a root-branching phenotype. Root-branching number of 3-week-old dso and wild-type (WT) plants is shown. Error bars represent
sd
. **, P < 0.01.
Figure 4.
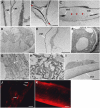
TEM pictures. A, The fusion area between dso-1 leaves in which the cuticles (cut) of either leaf align next to each other. B and C, Areas of leaf fusions in dso-1; red arrowheads mark areas in which the cuticle is absent; cuticles are indicated by arrows. D, F, G, and H, Unusual inclusions (arrows) in the epidermal cell cytoplasm of a dso-3 leaf (D and F), in the epidermal cell of a dso-2 stem (G), and in an epidermal cell of a dso-3 stem (H). E, Epidermal cell cytoplasm of wild-type leaf. I, Epidermal cell cytoplasm of wild-type stem. Fluorescence images in J and K show Nile Red staining of the stem epidermis tissue isolated from dso-3 and the wild type, respectively. Arrows in J indicate the inclusions. Bars = 200 nm in A, 1 _μ_m in B and E, 2 _μ_m in D, 500 nm in G and H, 1 _μ_m in F and I, and 100 _μ_m in J and K. [See online article for color version of this figure.]
Figure 5.
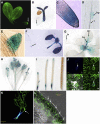
DSO 5′ upstream region directed expression. A, GFP expression driven by the DSO 5′ upstream region in the embryo. Expression in radical tip is indicated by an arrow. B to I, GUS expression driven by the DSO 5′ upstream region detected (after 24-h incubation) in: 3-d-old seedling, expression in root cap is indicated by an arrow (B), a higher magnification image of a stained root cap (C); in the vasculature (v) of developing root and at the lateral root primordia (lrp; D); in the emerging lateral root (E); in a 7-d-old seedling (arrow marks lateral root emergence sites; F); in a 15-d-old seedling, expression in the lateral root (lr), main vein (mv), and basal segment (bs) of the leaf is indicated by arrows (G); in the inflorescence (H); and in the developing siliques (I). J, Confocal microscopy images of GFP expression driven by the DSO 5′ upstream region in the adaxial leaf epidermis (i, autofluorescence; ii, GFP signal; iii, merge of GFP with transmission; iv, merge between autofluorescence and GFP). The GFP signal is indicated by arrow. The blue signal marks autofluorescence in the cuticular ledges. K, Confocal microscopy images of GFP expression driven by the DSO 5′ upstream region in the adaxial leaf epidermis showing GFP signal in the trichome base (indicated by arrow) and support cells. L, Images of GFP expression driven by the DSO 5′ upstream region in a free-hand stem cross section. Arrows indicate GFP signal in epidermis. GFP signal was also detected in other stem tissues. Bar = 50 _μ_m in A.
Figure 6.
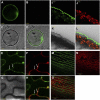
Localization of DSO-GFP protein fusion to the plasma membrane of epidermal cells. A to D, Confocal microscopy of epidermal protoplasts derived from plants harboring the p_DSO_∷GFP_-DSO construct (GFP fused in the N termini) are shown. Protoplasts were prepared from stem epidermis-enriched tissue and analyzed for DSO subcellular localization. Images were acquired through: GFP filter (A), chlorophyll filter (B), transmission (C), and a merge (D) between A and C. E to H, Whole-mount confocal microscopy of leaves derived from plants harboring the p_DSO_∷_GFP_-DSO construct (GFP fused in the N termini). Images were acquired through: GFP filter (E), chlorophyll filter (F), transmission (G), and a merge (H) between E and F. FM4-64 (red signal) is a plasma membrane marker and was used in F. FM4-64 was used in H for colocalization with the GFP signal. Arrows indicate GFP in E and H and FM4-64 in F and H. I to L, Confocal microscopy of stem cross sections of plants harboring the p_DSO_∷_GFP-DSO construct. Images were acquired through: GFP filter (I), chlorophyll filter (J), transmission (K), and a merge (L) between I, J, and K. M to O, Whole-mount confocal microscopy of stems derived from plants harboring the p_DSO_∷GFP-DSO construct (GFP fused in the N termini). Images were acquired through: GFP filter (M), chlorophyll filter (N), and a merge (O) between M and N.
Figure 7.
Reduced epicuticular wax and cutin monomers load in dso-3 plants. A, Stem wax load of dso-3 plants versus the wild type. *, P < 0.05; **, P < 0.01. B, Cutin monomer load of dso-3 plants versus the wild type. The differences were significant between all bars with P < 0.01. Error bars are
sd
in both A and B. For identities of major cutin monomers identified in leaf cuticles of dso-3 and wild-type plants, see Table II.
Figure 8.
Induction of DSO and related gene expression by different stresses and sensitivity of the dso-1 lines to salinity. A, Semiquantitative RT-PCR experiments showing DSO (WBC11), CER5 (WBC12), and WBC13 expression under 200 m
m
NaCL and 50 μ
m
ABA treatments. The β-actin gene served as a control for equal loading of cDNA. B, Wound induction detected in plants expressing GUS driven by the DSO 5′ upstream region. C and D, The decrease in DSO expression results in salt susceptibility as detected in 2-week-old dso-1 seedlings exposed to 200 m
m
NaCl for 4 d (C) and a wild-type seedling exposed to the same treatment (D).
Similar articles
- The Arabidopsis DSO/ABCG11 transporter affects cutin metabolism in reproductive organs and suberin in roots.
Panikashvili D, Shi JX, Bocobza S, Franke RB, Schreiber L, Aharoni A. Panikashvili D, et al. Mol Plant. 2010 May;3(3):563-75. doi: 10.1093/mp/ssp103. Epub 2009 Dec 24. Mol Plant. 2010. PMID: 20035035 - Characterization of Arabidopsis ABCG11/WBC11, an ATP binding cassette (ABC) transporter that is required for cuticular lipid secretion.
Bird D, Beisson F, Brigham A, Shin J, Greer S, Jetter R, Kunst L, Wu X, Yephremov A, Samuels L. Bird D, et al. Plant J. 2007 Nov;52(3):485-98. doi: 10.1111/j.1365-313X.2007.03252.x. Epub 2007 Aug 28. Plant J. 2007. PMID: 17727615 - A member of the PLEIOTROPIC DRUG RESISTANCE family of ATP binding cassette transporters is required for the formation of a functional cuticle in Arabidopsis.
Bessire M, Borel S, Fabre G, Carraça L, Efremova N, Yephremov A, Cao Y, Jetter R, Jacquat AC, Métraux JP, Nawrath C. Bessire M, et al. Plant Cell. 2011 May;23(5):1958-70. doi: 10.1105/tpc.111.083121. Epub 2011 May 31. Plant Cell. 2011. PMID: 21628525 Free PMC article. - Arabidopsis cuticular waxes: advances in synthesis, export and regulation.
Bernard A, Joubès J. Bernard A, et al. Prog Lipid Res. 2013 Jan;52(1):110-29. doi: 10.1016/j.plipres.2012.10.002. Epub 2012 Oct 26. Prog Lipid Res. 2013. PMID: 23103356 Review. - Sealing plant surfaces: cuticular wax formation by epidermal cells.
Samuels L, Kunst L, Jetter R. Samuels L, et al. Annu Rev Plant Biol. 2008;59:683-707. doi: 10.1146/annurev.arplant.59.103006.093219. Annu Rev Plant Biol. 2008. PMID: 18251711 Review.
Cited by
- Transcriptomic Analysis Reveals Key Candidate Genes Related to Seed Abortion in Chinese Jujube (Ziziphus jujuba Mill).
Shao F, Yin H, Wang S, Zhang S, Chen J, Feng C. Shao F, et al. Curr Genomics. 2022 Apr 7;23(1):26-40. doi: 10.2174/1389202922666211110100017. Curr Genomics. 2022. PMID: 35814940 Free PMC article. - Lipidomic, Transcriptomic, and BSA-660K Single Nucleotide Polymorphisms Profiling Reveal Characteristics of the Cuticular Wax in Wheat.
Zheng J, Yang C, Zheng X, Yan S, Qu F, Zhao J, Pei Y. Zheng J, et al. Front Plant Sci. 2021 Nov 24;12:794878. doi: 10.3389/fpls.2021.794878. eCollection 2021. Front Plant Sci. 2021. PMID: 34899814 Free PMC article. - Dynamic relationships among pathways producing hydrocarbons and fatty acids of maize silk cuticular waxes.
Chen K, Alexander LE, Mahgoub U, Okazaki Y, Higashi Y, Perera AM, Showman LJ, Loneman D, Dennison TS, Lopez M, Claussen R, Peddicord L, Saito K, Lauter N, Dorman KS, Nikolau BJ, Yandeau-Nelson MD. Chen K, et al. Plant Physiol. 2024 Jun 28;195(3):2234-2255. doi: 10.1093/plphys/kiae150. Plant Physiol. 2024. PMID: 38537616 Free PMC article. - DEWAX Transcription Factor Is Involved in Resistance to Botrytis cinerea in Arabidopsis thaliana and Camelina sativa.
Ju S, Go YS, Choi HJ, Park JM, Suh MC. Ju S, et al. Front Plant Sci. 2017 Jul 11;8:1210. doi: 10.3389/fpls.2017.01210. eCollection 2017. Front Plant Sci. 2017. PMID: 28744297 Free PMC article. - BnMs3 is required for tapetal differentiation and degradation, microspore separation, and pollen-wall biosynthesis in Brassica napus.
Zhou Z, Dun X, Xia S, Shi D, Qin M, Yi B, Wen J, Shen J, Ma C, Tu J, Fu T. Zhou Z, et al. J Exp Bot. 2012 Mar;63(5):2041-58. doi: 10.1093/jxb/err405. Epub 2011 Dec 15. J Exp Bot. 2012. PMID: 22174440 Free PMC article.
References
- Alonso JM, Stepanova AN, Leisse TJ, Kim CJ, Chen H, Shinn P, Stevenson DK, Zimmerman J, Barajas P, Cheuk R, et al (2003) Genome-wide insertional mutagenesis of Arabidopsis thaliana. Science 301 653–657 - PubMed
- Berge KE, Tian H, Graf GA, Yu L, Grishin NV, Schultz J, Kwiterovich P, Shan B, Barnes R, Hobbs HH (2000) Accumulation of dietary cholesterol in sitosterolemia caused by mutations in adjacent ABC transporters. Science 290 1771–1775 - PubMed
Publication types
MeSH terms
Substances
LinkOut - more resources
Full Text Sources
Other Literature Sources
Molecular Biology Databases


