Developmental expression of Ca2+-permeable AMPA receptors underlies depolarization-induced long-term depression at mossy fiber CA3 pyramid synapses - PubMed (original) (raw)
Comparative Study
Developmental expression of Ca2+-permeable AMPA receptors underlies depolarization-induced long-term depression at mossy fiber CA3 pyramid synapses
Michelle T-W Ho et al. J Neurosci. 2007.
Abstract
Many central excitatory synapses undergo developmental alterations in the molecular and biophysical characteristics of postsynaptic ionotropic glutamate receptors via changes in subunit composition. Concerning AMPA receptors (AMPARs), glutamate receptor 2 subunit (GluR2)-containing, Ca2+-impermeable AMPARs (CI-AMPARs) prevail at synapses between mature principal neurons; however, accumulating evidence indicates that GluR2-lacking, Ca2+-permeable AMPARs (CP-AMPARs) contribute at these synapses early in development. Here, we used a combination of imaging and electrophysiological recording techniques to investigate potential roles for CP-AMPARs at developing hippocampal mossy fiber-CA3 pyramidal cell (MF-PYR) synapses. We found that transmission at nascent MF-PYR synapses is mediated by a mixed population of CP- and CI-AMPARs as evidenced by polyamine-dependent inwardly rectifying current-voltage (I-V) relationships, and partial philanthotoxin sensitivity of synaptic events. CP-AMPAR expression at MF-PYR synapses is transient, being limited to the first 3 postnatal weeks. Moreover, the expression of CP-AMPARs is regulated by the PDZ (postsynaptic density-95/Discs large/zona occludens-1) domain-containing protein interacting with C kinase 1 (PICK1), because MF-PYR synapses in young PICK1 knock-out mice are philanthotoxin insensitive with linear I-V relationships. Strikingly, MF-PYR transmission via CP-AMPARs is selectively depressed during depolarization-induced long-term depression (DiLTD), a postsynaptic form of MF-PYR plasticity observed only at young MF-PYR synapses. The selective depression of CP-AMPARs during DiLTD was evident as a loss of postsynaptic CP-AMPAR-mediated Ca2+ transients in PYR spines and reduced rectification of MF-PYR synaptic currents. Preferential targeting of CP-AMPARs during DiLTD is further supported by a lack of DiLTD in young PICK1 knock-out mice. Together, these findings indicate that the transient participation of CP-AMPARs at young MF-PYR synapses dictates the developmental window to observe DiLTD.
Figures
Figure 1.
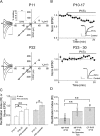
Developmental expression of CP-AMPARs at MF–PYR synapses. A, Representative MF–PYR evoked EPSC I–V relationship (_V_hold from −60 to +40 mV in steps of 20 mV) obtained from a P11 mouse (top panel) and a P22 mouse (bottom panel). Traces are the average of 5–10 events at each holding potential (black). The EPSC at −60 mV after 5 min of DCGIV application to confirm MF origin is indicated in gray. The right panels show plots of the I–V relationship: the solid lines represent the linear fit to data points between the −60 and 0 mV holding potentials. The dotted line extends this fit to highlight the deviation of the I–V relationship at P11 from linearity. B, Normalized group data show dot plots for the effect of PhTx (2 μ
m
) on evoked MF–PYR EPSCs in slices from mice aged P10–P17 (top panel; n = 16) and P23–P30 (bottom panel; n = 4). Plotted are the 1 min running average EPSC amplitudes normalized to the average response obtained from the first 5 min of recording before PhTx application. The inset traces are from representative recordings showing average EPSCs (20 events) before (control) and after PhTx treatment (PhTx). C, Summary histogram illustrating the average RI values for, and effects of PhTx on, MF–PYR transmission for the indicated age ranges. PhTx data are expressed as the average EPSC amplitude at the end of PhTx treatment normalized to the average EPSC amplitude obtained immediately preceding PhTx application and are from the recordings in B. RI values were calculated as the ratio of the actual current amplitude at +40 mV to the predicted linear value at +40 mV based on the linear fits of I–V relationships illustrated in A (n = 13 for P10–P17; n = 10 for P18–P22; and n = 10 for P23). D, Bar graph summary comparing the RIs obtained in recordings from P10–P17 mice for MF–PYR synapses (n = 13; replotted from C), collateral fiber–PYR synapses (n = 5), and for MF–PYR synapses when spermine was omitted from the ICS (n = 7). Calibration: 100 pA, 10 ms (throughout the figure). Error bars indicate SEM. Here and throughout, *p < 0.05 and **p < 0.01.
Figure 2.
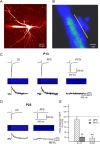
CP-AMPARs mediate CaTs at developing MF–PYR synapses. A, A multiphoton image (_z_-stack) of 60 optical sections taken at 1 μm intervals of an Oregon Green-filled PYR in which MF stimulation evoked CaTs were monitored. B, A pseudocolor image showing basal fluorescence in a thorny excrescence located along the proximal dendrite of the PYR in A (arrow). The position of the line scan used to monitor stimulus evoked Ca2+ signals is indicated parallel to the parent dendrite. C, A representative recording from a P13 rat showing the effects of
d
-AP5 (50 μ
m
) and PhTx (2 μ
m
) on stimulus evoked CaTs recorded in a thorny excrescence (middle images and bottom traces show raw line scan images and associated CaTs, respectively; average of 4 consecutive events under each condition) and simultaneously monitored EPSCs (top traces; average of 4 consecutive events under each condition). D, Representative recording from a P25 rat showing the effects of AP5 on stimulus evoked CaTs and simultaneously monitored EPSCs. E, Summary histogram for group data examining the effects of AP5 and PhTx on stimulus-evoked CaTs in thorny excrescences from rats aged P10–P16 (n = 5) and of AP5 on CaTs in rats older than P23 (n = 4). Data are expressed as percentage of control responses that were obtained before any drug treatment. Error bars indicate SEM. **p < 0.01, paired t test.
Figure 3.
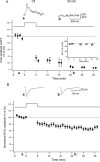
DiLTD results in a loss of postsynaptic MF–PYR CaTs. A, Group data time course plot for experiments in which stimulus evoked CaTs were continuously monitored before and after the DiLTD induction protocol (time, 0 min) was applied (n = 5). CaTs (average of 4 events) were monitored at regular intervals during the recordings and expressed as percentage of control CaTs obtained during the baseline recording period. The traces above are CaTs obtained at the times indicated from a representative recording that was subject to the DiLTD induction protocol. The inset time course plot summarizes control recordings in which stimulation was interrupted but PYRs were not subject to depolarization (n = 3). B, Group data time course plot showing DiLTD of EPSCs that were recorded during CaT monitoring. EPSC amplitudes for each recording were binned to yield 1 min running averages and are expressed as percentage of control responses obtained during the baseline (preinduction) period. The traces above are EPSCs obtained at the times indicated from the same representative recording that yielded the example CaTs in A. Error bars indicate SEM.
Figure 4.
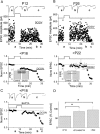
Developmental expression of DiLTD at mouse MF–PYR synapses. A, EPSC amplitude time course plot from a representative recording (top panel) and normalized group data (bottom panel; binned in 1 min intervals and normalized to the first 5 min of recordings) illustrating DiLTD in slices from mice younger than P18 (n = 26). The traces above (and throughout the figure) are the average of 20 consecutive EPSC pairs obtained at the times indicated [calbration: 100 pA, 20 ms (throughout the figure)]. Stimulation is paused during induction when the holding potential is moved from −60 to −10 mV for 5 min as indicated. Sensitivity of synaptic events to DCGIV (1 μ
m
) at the end of recordings confirms that inputs are mossy fiber in origin. The inset bar graph in the bottom panel summarizes the PPRs obtained before and after DiLTD induction for a subset of the recordings. B, Similar to A, but for recordings performed in slices from mice older than P22 (n = 4). C, Normalized group data for recordings in which the DiLTD induction protocol was attempted in slices from mice younger than P18 with BAPTA (20 m
m
)-supplemented ICS (n = 5). D, Bar graph summary comparing DiLTD for interleaved recordings performed under the conditions indicated. Data are from the recordings making up the group plots in A–C and represent EPSC amplitudes measured at 15 min after induction expressed as percentage of control responses obtained immediately preceding induction (*p < 0.05). Error bars indicate SEM.
Figure 5.
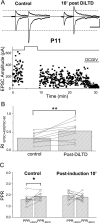
DiLTD reduces rectification of MF–PYR synapses. A, Representative recording in which RIEPSC+40/EPSC−60 was monitored before and after DiLTD induction in a slice from a P11 mouse (calibration: 100 pA, 50 ms). The traces above show averaged EPSC pairs evoked at _V_h of +40 and −60 mV before DiLTD induction (Control) and 10 min after DiLTD induction (10′ post DiLTD). The bottom panel shows the time course plot of all MF–PYR EPSC amplitudes for this recording before and after DiLTD induction. B, Group data for 10 recordings similar to that illustrated in A performed in slices from mice aged P10–P17 reveals a significant increase in RIEPSC+40/EPSC−60 after DiLTD induction (**p < 0.01). Each individual recording is represented by an open circle with the group mean plotted as a bar. C, PPRs measured at holding potentials of +40 and −60 mV before and after DiLTD induction for a subset of the recordings in which RIEPSC+40/EPSC−60 was monitored (n = 8; *p < 0.05). Individual recordings are represented by open circles with group means plotted as bars. Before DiLTD induction the PPR at +40 mV is significantly less than that observed at −60 mV in the same recordings, but after DiLTD the PPRs at +40 and −60 mV are not significantly different.
Figure 6.
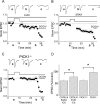
Disruption of PICK1 inhibits DiLTD. A, B, Group data EPSC amplitude time course plots for recordings in which DiLTD induction was attempted in slices from P10–P17 C57BL/6 mice using EVKI-supplemented ICS (A; n = 5) or SGKA-supplemented ICS (B; n = 5). The traces above are from representative recordings obtained at the times indicated. C, Group data EPSC amplitude time course plot for recordings in which DiLTD induction was attempted in slices from P10–P17 PICK1−/− mice (n = 11 and 10, 10 and 15 min after induction, respectively). The traces above were obtained during a representative recording at the times indicated. For A–C, EPSC amplitudes were binned as 1 min running averages and normalized to the average EPSC amplitude obtained during the baseline (preinduction) recording period. D, Summary histogram for data presented in A–C and for recordings performed in P10–P17 PICK1+/+ littermate control mice (n = 4). Data represent the EPSC amplitudes at 15 min after induction expressed as a percentage of control responses obtained immediately preceding induction (*p < 0.05). The traces throughout are the average of 20 consecutive events. Calibration: 100 pA, 20 ms. Error bars indicate SEM.
Figure 7.
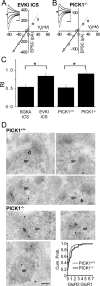
Loss of CP-AMPARs at developing MF–PYR synapses after PICK1 disruption. A, MF–PYR EPSC I–V relationship (_V_hold from −60 to +40 mV in steps of 20 mV) obtained during a representative recording in a slice from a P14 C57BL/6 mouse using EVKI-containing ICS. The line is the linear fit to data points for holding potentials between −60 and 0 mV. The traces are the average of 5–10 events at each holding potential (calibration: 100 pA, 10 ms). B, Representative MF–PYR EPSC I–V relationship obtained in a slice from a P14 PICK1−/− mouse (calibration: 50 pA, 10 ms). C, Group data summary bar chart for RI values obtained in slices from C57BL/6 mice aged P10–P17 using ICS supplemented with EVKI (n = 5) or SGKA (n = 5). Also shown is the group data summary bar chart of RI values obtained in P10–P17 PICK1−/− (n = 11) and PICK1+/+ (n = 5) mice. Error bars indicate SEM. D, Representative photomicrographs of immunogold labeling in PYR spine profiles (SPs) for GluR1 (5 nm gold particle) and GluR2 (15 nm gold particles) in PICK1+/+ mice (top panel; three micrographs showing 4 SPs) and PICK1−/− mice (bottom left panel; 3 micrographs each with 1 SP). The bottom right panel is a cumulative probability histogram (bin width, 0.1) of GluR2/GluR1 signal ratios in SP membranes of PICK1+/+ mice (n = 87 SPs from 3 animals) and PICK1−/− mice (n = 66 SPs from 3 animals). Scale bar (bottom left photomicrograph), 100 nm. *p < 0.05 throughout the figure.
Similar articles
- Burst firing induces postsynaptic LTD at developing mossy fibre-CA3 pyramid synapses.
Ho MT, Pelkey KA, Pelletier JG, Huganir RL, Lacaille JC, McBain CJ. Ho MT, et al. J Physiol. 2009 Sep 15;587(Pt 18):4441-54. doi: 10.1113/jphysiol.2009.173880. Epub 2009 Jul 27. J Physiol. 2009. PMID: 19635819 Free PMC article. - Input- and subunit-specific AMPA receptor trafficking underlying long-term potentiation at hippocampal CA3 synapses.
Kakegawa W, Tsuzuki K, Yoshida Y, Kameyama K, Ozawa S. Kakegawa W, et al. Eur J Neurosci. 2004 Jul;20(1):101-10. doi: 10.1111/j.1460-9568.2004.03461.x. Eur J Neurosci. 2004. PMID: 15245483 - Depolarization-induced long-term depression at hippocampal mossy fiber-CA3 pyramidal neuron synapses.
Lei S, Pelkey KA, Topolnik L, Congar P, Lacaille JC, McBain CJ. Lei S, et al. J Neurosci. 2003 Oct 29;23(30):9786-95. doi: 10.1523/JNEUROSCI.23-30-09786.2003. J Neurosci. 2003. PMID: 14586006 Free PMC article. - The AMPAR subunit GluR2: still front and center-stage.
Tanaka H, Grooms SY, Bennett MV, Zukin RS. Tanaka H, et al. Brain Res. 2000 Dec 15;886(1-2):190-207. doi: 10.1016/s0006-8993(00)02951-6. Brain Res. 2000. PMID: 11119696 Review. - Role of giant depolarizing potentials in shaping synaptic currents in the developing hippocampus.
Mohajerani MH, Cherubini E. Mohajerani MH, et al. Crit Rev Neurobiol. 2006;18(1-2):13-23. doi: 10.1615/critrevneurobiol.v18.i1-2.30. Crit Rev Neurobiol. 2006. PMID: 17725505 Review.
Cited by
- AMPA and GABA(A/B) receptor subunit expression in the cortex of adult squirrel monkeys during peripheral nerve regeneration.
Mowery TM, Walls SM, Garraghty PE. Mowery TM, et al. Brain Res. 2013 Jul 3;1520:80-94. doi: 10.1016/j.brainres.2013.04.032. Epub 2013 May 2. Brain Res. 2013. PMID: 23643858 Free PMC article. - Synaptic lability after experience-dependent plasticity is not mediated by calcium-permeable AMPARs.
Wen JA, Barth AL. Wen JA, et al. Front Mol Neurosci. 2012 Feb 29;5:15. doi: 10.3389/fnmol.2012.00015. eCollection 2012. Front Mol Neurosci. 2012. PMID: 22393315 Free PMC article. - Symmetric spike timing-dependent plasticity at CA3-CA3 synapses optimizes storage and recall in autoassociative networks.
Mishra RK, Kim S, Guzman SJ, Jonas P. Mishra RK, et al. Nat Commun. 2016 May 13;7:11552. doi: 10.1038/ncomms11552. Nat Commun. 2016. PMID: 27174042 Free PMC article. - Developmental regulation of protein interacting with C kinase 1 (PICK1) function in hippocampal synaptic plasticity and learning.
Volk L, Kim CH, Takamiya K, Yu Y, Huganir RL. Volk L, et al. Proc Natl Acad Sci U S A. 2010 Dec 14;107(50):21784-9. doi: 10.1073/pnas.1016103107. Epub 2010 Nov 24. Proc Natl Acad Sci U S A. 2010. PMID: 21106762 Free PMC article. - Hippocampal GABAergic Inhibitory Interneurons.
Pelkey KA, Chittajallu R, Craig MT, Tricoire L, Wester JC, McBain CJ. Pelkey KA, et al. Physiol Rev. 2017 Oct 1;97(4):1619-1747. doi: 10.1152/physrev.00007.2017. Physiol Rev. 2017. PMID: 28954853 Free PMC article. Review.
References
- Aizenman CD, Munoz-Elias G, Cline HT. Visually driven modulation of glutamatergic synaptic transmission is mediated by the regulation of intracellular polyamines. Neuron. 2002;34:623–634. - PubMed
- Amaral DG, Dent JA. Development of the mossy fibers of the dentate gyrus: I. A light and electron microscopic study of the mossy fibers and their expansions. J Comp Neurol. 1981;195:51–86. - PubMed
- Arundine M, Tymianski M. Molecular mechanisms of calcium-dependent neurodegeneration in excitotoxicity. Cell Calcium. 2003;34:325–337. - PubMed
- Bellone C, Luscher C. mGluRs induce a long-term depression in the ventral tegmental area that involves a switch of the subunit composition of AMPA receptors. Eur J Neurosci. 2005;21:1280–1288. - PubMed
Publication types
MeSH terms
Substances
LinkOut - more resources
Full Text Sources
Miscellaneous
