Loss of the SdhB, but Not the SdhA, subunit of complex II triggers reactive oxygen species-dependent hypoxia-inducible factor activation and tumorigenesis - PubMed (original) (raw)
Loss of the SdhB, but Not the SdhA, subunit of complex II triggers reactive oxygen species-dependent hypoxia-inducible factor activation and tumorigenesis
Robert D Guzy et al. Mol Cell Biol. 2008 Jan.
Abstract
Mitochondrial complex II is a tumor suppressor comprised of four subunits (SdhA, SdhB, SdhC, and SdhD). Mutations in any of these should disrupt complex II enzymatic activity, yet defects in SdhA produce bioenergetic deficiency while defects in SdhB, SdhC, or SdhD induce tumor formation. The mechanisms underlying these differences are not known. We show that the inhibition of distal subunits of complex II, either pharmacologically or via RNA interference of SdhB, increases normoxic reactive oxygen species (ROS) production, increases hypoxia-inducible factor alpha (HIF-alpha) stabilization in an ROS-dependent manner, and increases growth rates in vitro and in vivo without affecting hypoxia-mediated activation of HIF-alpha. Proximal pharmacologic inhibition or RNA interference of complex II at SdhA, however, does not increase normoxic ROS production or HIF-alpha stabilization and results in decreased growth rates in vitro and in vivo. Furthermore, the enhanced growth rates resulting from SdhB suppression are inhibited by the suppression of HIF-1alpha and/or HIF-2alpha, indicating that the mechanism of SdhB-induced tumor formation relies upon ROS production and subsequent HIF-alpha activation. Therefore, differences in ROS production, HIF proliferation, and cell proliferation contribute to the differences in tumor phenotype in cells lacking SdhB as opposed to those lacking SdhA.
Figures
FIG. 1.
Mitochondrial complex II. The relationships among the four subunits are shown, along with the sites of activation or inhibition.
FIG. 2.
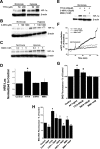
HIF-1α stabilization and ROS production during pharmacological inhibition of complex II. Wild-type Hep3B cells were treated with TTFA (200 μM) (A), 3-NPA (100 μM) (B), MMA (1 mM) (C), or combinations of these drugs (E) for 4 h under normoxic or hypoxic conditions. HIF-1α and β-actin were detected via immunoblotting. (D) Wild-type 143B cells were transfected with plasmids containing HRE-luciferase (HRE-Luc) and CMV-β-galactosidase and then treated with TTFA (200 μM), 3-NPA (100 μM), or MMA (1 mM) for 4 h. Lysates were analyzed for luciferase activity and corrected for transfection efficiency using β-galactosidase. *, P < 0.05. (F) 143B cells were infected with an adenovirus encoding roGFP, allowed to recover for 24 h, and imaged every 60 s during perfusion with buffer containing the indicated compounds for 30 min. The ratio of baseline oxidation of roGFP is indicated as 100%; values greater than 100% represent oxidation, whereas values less than 100% represent the reduction of the level of the sensor relative to baseline redox levels. (G) Superoxide production as assessed by DHE fluorescence in wild-type 143B cells treated with AA (1 μM), TTFA (200 μM), 3-NPA (100 μM), or MMA (1 mM). After treatment for 5 h, DHE (1 μM) was added for an additional hour. Cells were trypsinized, collected, and analyzed by flow cytometry. Values are shown as percentages relative to values for controls. *, P < 0.05. (H) Cells were treated with the indicated compounds for 5 h, after which Mito-SOX (1 μM) was added for an additional hour. Cells were trypsinized, collected, and analyzed by flow cytometry. Cont, control. Values are shown as percentages relative to values for controls. *, P < 0.05.
FIG. 3.
Complex II activity, oxidant stress, normoxic HIF-1α stabilization, and HRE-luciferase reporter gene activity in A549, Hep3B, and 143B cells during the suppression of SdhB expression. (A) Complex II activity of 143B clone 4F or 5E, A549 clone 4-2, and Hep3B polyclonal line 2, compared to that of the respective wild-type (WT) cells, given as percentages. *, P < 0.05. (B) Normoxic levels of HIF-1α, SdhB, β-actin, Rieske iron-sulfur protein (RISP), and cytochrome oxidase subunit IV (Cox IV) were measured via immunoblotting in 143B WT cells and SdhB shRNA clones 4F and 5E. (C) Normoxic levels of HIF-1α measured by immunoblotting in A549 WT cells and SdhB shRNA clone 4-2 in the presence of the antioxidant ebselen (25 μM), 3-NPA (100 μM), or MMA (10 mM). Also shown are normoxic levels of HIF-1α measured in WT Hep3B cells and SdhB shRNA polyclonal cell line 2, in the presence of DMS (20 mM) or ebselen (25 μM), via immunoblotting. (D) Normoxic levels of HIF-1α measured by immunoblotting in WT 143B and A549 cells and SdhB shRNA clones in the presence (+) or absence of (−) 3-NPA (100 μM) or Mito-Q (1 μM). Immunoblots were quantified via densitometry and are presented as the increase (_n_-fold) above levels for WT normoxia controls. *, P < 0.05. (E) Normoxic HRE-luciferase expression analyzed in 143B WT, 143B mock shRNA, 143B SdhB shRNA clone 5E, A549 WT, and A549 SdhB clone 4-2 cells. Data are presented as the increase (_n_-fold) above the level for the cell-type-specific WT control. *, P < 0.05.
FIG. 4.
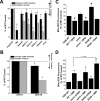
Increased ROS production in cells with shRNA suppression of SdhB. (A) Cells were infected with an adenovirus expressing the cytosolic oxidant-sensitive roGFP sensor, and the baseline oxidation of roGFP was measured and expressed as percent reduction. Oxidation of roGFP therefore causes a decrease in the reduction of the probe, as indicated by arrows to the right. The percent reduction of the roGFP probe relative to the level of probe of wild-type (WT) controls is presented in conjunction with complex II activity levels in Hep3B SdhB shRNA clones. All cell lines are monoclonal, except for Hep3B SdhB lines 2 and 4, which are polyclonal cell lines. TBP (20 μM) and TTFA (200 μM) are shown as controls. *, P < 0.05. (B) Oxidant stress assessed by the cytosolic oxidant-sensitive roGFP sensor in 143B wild-type cells, 143B cells with stable expression of mock shRNA, or 143B SdhB shRNA clone 5E cells, presented in conjunction with complex II activity levels. *, P < 0.05. (C) Normoxic ROS production in the mitochondrial matrix detected using the probe Mito-SOX red in WT 143B cells, 143B cells with stable expression of mock shRNA, or 143B SdhB shRNA clone 5E cells. Fluorescence intensity was measured by flow cytometry. Incubation with the SOD-mimetic TBAP was performed to assess the specificity of Mito-SOX for superoxide. Data are presented as percentages of WT control levels. *, P < 0.05. (D) Normoxic ROS production in the mitochondrial matrix detected using Mito-SOX red in the presence or absence of DMS (20 mM) and measured by flow cytometry in 143B cell lines. *, P < 0.05 compared to WT 143B cells and P < 0.05 for SdhB mutant cells with DMS compared to 143B WT cells with DMS.
FIG. 5.
Effects of shRNA suppression of SdhA on ROS production and HIF-α stabilization. (A) 143B cells stably transfected with SdhA shRNA demonstrated a significant decrease in SdhA expression compared to that of wild-type (WT) or SdhB shRNA cells. Levels of SdhA and HIF-1α under normoxic conditions were detected by immunoblotting and were quantified using densitometric analysis (Image J). Cells were either left untreated or cotransfected with HRE-luciferase and CMV-β-galactosidase reporter plasmids in order to assess HRE-luciferase expression, as described in Materials and Methods. *, P < 0.05 compared to levels for WT 143B cells; #, P < 0.05 compared to levels for SdhB shRNA clone 5E. (B) Complex II activity of a polyclonal SdhA shRNA line (SdhA polyclonal line 3) and a monoclonal SdhA shRNA line (SdhA polyclonal line 3C). Complex II activity was measured as described in Materials and Methods, and activity is expressed as the percentage of the level for WT 143B cells. *, P < 0.05. (C) Mito-SOX fluorescence in normoxic cells, determined as previously described. *, P < 0.05. (D) Percent reduction of the roGFP cytosolic redox sensor in mock shRNA, SdhA polyclonal line 3, and SdhA clone 3C cells under normoxia. No significant differences were detected. (E) 143B WT and SdhA shRNA cells were exposed to DMS (20 mM) or DMS plus Mito-Q (1 μM) under normoxic conditions. Normoxic HIF-1α levels were measured via immunoblotting and were quantified using densitometric analysis (Image J). Data are presented as percentages of normoxic HIF-1α expression for each cell type. *, P < 0.05.
FIG. 6.
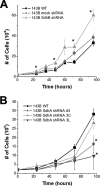
Increased rate of cell growth in vitro in SdhB shRNA, but not SdhA shRNA, cells. (A) 143B wild-type (WT), mock shRNA, and SdhB shRNA cells plated at 20,000 cells/well in 6-well plates were trypsinized, collected, and counted every 12 to 24 h. (B) 143B WT, SdhA shRNA polyclonal line 3, SdhA shRNA clone 3C, and SdhA shRNA clone 3L cells plated at 20,000 cells/well in 6-well plates were trypsinized, collected, and counted every 24 h. *, P < 0.05.
FIG. 7.
Increased rate of tumor growth and increased HIF-α stabilization in SdhB shRNA cell-derived tumors. (A and B) Athymic nude mice were injected with 1 × 10⁶ cells (143B wild type [WT], 143B mock shRNA, 143B SdhB shRNA clone 5E, or 143B SdhA shRNA polyclonal line 3 and clone 3C). Tumor growth was monitored for 35 days. Growth rates for SdhA shRNA polyclonal line 3 and 3C cell lines were virtually identical and have been combined in this graph. *, P < 0.05. (C) Upon excision, tumors were washed in cold PBS, and their mass was measured. *, P < 0.05. (D) Portions of the tumors were homogenized and lysed. Protein levels were measured by immunoblotting. Densitometric analysis of blots was carried out (Image J), corrected for β-actin levels, and normalized to WT levels. *, P < 0.05. Avg., average.
FIG. 8.
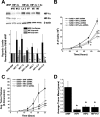
Effect of HIF-α suppression on cell growth and tumor formation. (A) 143B SdhB shRNA cells were stably infected with retroviruses expressing shRNA constructs targeting dHIF as controls or human HIF-1α and/or HIF-2α. HRE-luciferase expression and HIF-1α and HIF-2α protein levels were measured during hypoxia (1.5% O2). Values are normalized to those of the SdhB dHIF shRNA controls. *, P < 0.05. Ln 2, line 2. (B) Comparison of cell growth rates in cultures of SdhB shRNA cells with simultaneous dHIF, HIF-1α, and/or HIF-2α shRNA suppression. Cells plated at 20,000 cells/well in 6-well plates were trypsinized, collected, and counted every 24 h. *, P < 0.05. (C) Athymic nude mice were injected with 1 × 10⁶ cells (143B SdhB shRNA plus dHIF, HIF-1α, and/or HIF-2α shRNA suppression). Tumor growth was monitored for 25 days. *, P < 0.05. Avg., average. (D) Tumor weight in 143B SdhB shRNA cells with simultaneous dHIF, HIF-1α, and/or HIF-2α shRNA suppression after 25 days of growth in vivo. *, P < 0.05.
Similar articles
- Loss of SDHB Elevates Catecholamine Synthesis and Secretion Depending on ROS Production and HIF Stabilization.
Saito Y, Ishii KA, Aita Y, Ikeda T, Kawakami Y, Shimano H, Hara H, Takekoshi K. Saito Y, et al. Neurochem Res. 2016 Apr;41(4):696-706. doi: 10.1007/s11064-015-1738-3. Epub 2015 Nov 30. Neurochem Res. 2016. PMID: 26620190 - Mitochondrial complex II regulates a distinct oxygen sensing mechanism in monocytes.
Sharma S, Wang J, Cortes Gomez E, Taggart RT, Baysal BE. Sharma S, et al. Hum Mol Genet. 2017 Apr 1;26(7):1328-1339. doi: 10.1093/hmg/ddx041. Hum Mol Genet. 2017. PMID: 28204537 Free PMC article. - Identification of a signaling axis HIF-1α/microRNA-210/ISCU independent of SDH mutation that defines a subgroup of head and neck paragangliomas.
Merlo A, de Quiros SB, Secades P, Zambrano I, Balbín M, Astudillo A, Scola B, Arístegui M, Suarez C, Chiara MD. Merlo A, et al. J Clin Endocrinol Metab. 2012 Nov;97(11):E2194-200. doi: 10.1210/jc.2012-2410. Epub 2012 Sep 13. J Clin Endocrinol Metab. 2012. PMID: 22977270 - Phenotypic dichotomy in mitochondrial complex II genetic disorders.
Baysal BE, Rubinstein WS, Taschner PE. Baysal BE, et al. J Mol Med (Berl). 2001 Sep;79(9):495-503. doi: 10.1007/s001090100267. J Mol Med (Berl). 2001. PMID: 11692162 Review. - Model animals for the study of oxidative stress from complex II.
Ishii T, Miyazawa M, Onouchi H, Yasuda K, Hartman PS, Ishii N. Ishii T, et al. Biochim Biophys Acta. 2013 May;1827(5):588-97. doi: 10.1016/j.bbabio.2012.10.016. Epub 2012 Nov 6. Biochim Biophys Acta. 2013. PMID: 23142169 Review.
Cited by
- Redox signalling and mitochondrial stress responses; lessons from inborn errors of metabolism.
Olsen RK, Cornelius N, Gregersen N. Olsen RK, et al. J Inherit Metab Dis. 2015 Jul;38(4):703-19. doi: 10.1007/s10545-015-9861-5. Epub 2015 May 30. J Inherit Metab Dis. 2015. PMID: 26025548 Free PMC article. Review. - Succinate dehydrogenase upregulation destabilize complex I and limits the lifespan of gas-1 mutant.
Pujol C, Bratic-Hench I, Sumakovic M, Hench J, Mourier A, Baumann L, Pavlenko V, Trifunovic A. Pujol C, et al. PLoS One. 2013;8(3):e59493. doi: 10.1371/journal.pone.0059493. Epub 2013 Mar 28. PLoS One. 2013. PMID: 23555681 Free PMC article. - Perinuclear mitochondrial clustering creates an oxidant-rich nuclear domain required for hypoxia-induced transcription.
Al-Mehdi AB, Pastukh VM, Swiger BM, Reed DJ, Patel MR, Bardwell GC, Pastukh VV, Alexeyev MF, Gillespie MN. Al-Mehdi AB, et al. Sci Signal. 2012 Jul 3;5(231):ra47. doi: 10.1126/scisignal.2002712. Sci Signal. 2012. PMID: 22763339 Free PMC article. - Prolyl hydroxylase domain enzymes: important regulators of cancer metabolism.
Yang M, Su H, Soga T, Kranc KR, Pollard PJ. Yang M, et al. Hypoxia (Auckl). 2014 Aug 30;2:127-142. doi: 10.2147/HP.S47968. eCollection 2014. Hypoxia (Auckl). 2014. PMID: 27774472 Free PMC article. Review. - Dysregulation of hypoxia pathways in fumarate hydratase-deficient cells is independent of defective mitochondrial metabolism.
O'Flaherty L, Adam J, Heather LC, Zhdanov AV, Chung YL, Miranda MX, Croft J, Olpin S, Clarke K, Pugh CW, Griffiths J, Papkovsky D, Ashrafian H, Ratcliffe PJ, Pollard PJ. O'Flaherty L, et al. Hum Mol Genet. 2010 Oct 1;19(19):3844-51. doi: 10.1093/hmg/ddq305. Epub 2010 Jul 21. Hum Mol Genet. 2010. PMID: 20660115 Free PMC article.
References
- Ackrell, B. A. C. 2000. Progress in understanding structure-function relationships in respiratory chain complex II. FEBS Lett. 4661-5. - PubMed
- Astrom, K., J. E. Cohen, J. E. Willett-Brozick, C. E. Aston, and B. E. Baysal. 2003. Altitude is a phenotypic modifier in hereditary paraganglioma type 1: evidence for an oxygen-sensing defect. Hum. Genet. 113228-237. - PubMed
- Baysal, B. E., R. E. Ferrell, J. E. Willett-Brozick, E. C. Lawrence, D. Myssiorek, A. Bosch, A. van der Mey, P. E. Taschner, W. S. Rubinstein, E. N. Myers, C. W. Richard III, C. J. Cornelisse, P. Devilee, and B. Devlin. 2000. Mutations in SDHD, a mitochondrial complex II gene, in hereditary paraganglioma. Science 287848-851. - PubMed
- Baysal, B. E., and E. N. Myers. 2002. Etiopathogenesis and clinical presentation of carotid body tumors. Microsc. Res. Tech. 59256-261. - PubMed
Publication types
MeSH terms
Substances
Grants and funding
- HL35440/HL/NHLBI NIH HHS/United States
- HL079650/HL/NHLBI NIH HHS/United States
- R01 HL035440/HL/NHLBI NIH HHS/United States
- R01 HL079650/HL/NHLBI NIH HHS/United States
- HL32646/HL/NHLBI NIH HHS/United States
LinkOut - more resources
Full Text Sources
Other Literature Sources
Miscellaneous


