Ets2 is required for trophoblast stem cell self-renewal - PubMed (original) (raw)
Ets2 is required for trophoblast stem cell self-renewal
Fang Wen et al. Dev Biol. 2007.
Abstract
The Ets2 transcription factor is essential for the development of the mouse placenta and for generating signals for embryonic mesoderm and axis formation. Using a conditional targeted Ets2 allele, we show that Ets2 is essential for trophoblast stem (TS) cells self-renewal. Inactivation of Ets2 results in TS cell slower growth, increased expression of a subset of differentiation-associated genes and decreased expression of several genes implicated in TS self-renewal. Among the direct TS targets of Ets2 is Cdx2, a key master regulator of TS cell state. Thus Ets2 contributes to the regulation of multiple genes important for maintaining the undifferentiated state of TS cells and as candidate signals for embryonic development.
Figures
Figure 1. Generation of an Ets2 conditional allele
(A) Schematic of the targeting construct, the wild-type Ets2 allele, the targeted Ets2flox-neo allele, the conditional Ets2flox and the inactivated Ets2db2 allele following Flp- and Cre-mediated recombination, respectively. The frt and loxP sites are indicated by filled and open arrowheads, respectively. The 3.8-kb 5′ arm of homology and the 2.6-kb 3′ arm of homology, indicated by the dashed lines, direct the homologous recombination. The diagnostic BamHI restriction fragments are depicted by solid lines. The 3′ probe used for Southern blot analysis and the primers (a, b and c) used for PCR genotyping are indicated by the filled box and arrows, respectively. B, BamHI; E, EcoRI; P, PshAI. (B) Southern blot analysis of BamHI-digested genomic DNA from ES cells hybridized with the 3′ probe. A representative blot of 16 ES cell clones is shown here.
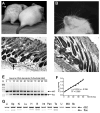
Figure 2. Rescue of Ets2db2 lethality by MORE mice
(A-D) Recapitulation of the “waved” hair phenotype in MORE;Ets2db2/db2 mice. (A) Waved hair (arrow) in comparison to a MORE;Ets2db2/wt littermate. (B) Curly whiskers. (C and D) Hematoxylin and eosin-stained (H&E) sections of the skin show misaligned hair follicles and foci of several dysplastic follicles (arrows), respectively. (E) A representative gel picture of the Ets2 PCR result with genomic DNA standards containing denoted allele ratios. Primers a, b and c (depicted in Fig. 1 A) were used to amplify a 217-bp product from Ets2flox and a 280-bp product from Etsdb2. (F) A standard curve was drawn accordingly plotting the ratio of the Ets2flox band density to Ets2db2 band density as a function of Ets2flox content. Also shown are the linear regression equation and R2 value. (G) PCR genotyping of the somatic tissues from the rescued MORE;Ets2db2/db2 adults: Li, liver; Sp, spleen; Ki, kidney; Lu, lung; H, heart; B, brain; Int, intestine; Pan, pancreas; Te, testis; U, uterus; MG, mammary gland; Sk, skin. The percentages of Ets2db2, calculated from the standard curve, were more than 95% for all the samples except for the testis (87%). The genomic DNA was extracted from the tissues of one male and one female mouse. Similar results were obtained with samples from additional mice.
Figure 3. Selection against Ets2db2 allele in AdCreGFP-infected Ets2flox/flox TS cells
(A) Growth curve of Ets2flox/flox TS cells that were mock infected, infected with AdGFP, or infected with AdCreGFP. Cells were plated at 3 dpi, and averages of cell numbers in duplicate wells were plotted as a function of culture time in GM. Also shown are exponential trend line equations. (B) Agarose gel analysis of Ets2 PCR products in Ets2flox/flox TS cells post AdCreGFP infection. The percent Ets2flox allele was calculated by comparison to the mixed standards. (C) Deduced growth curves of Ets2flox/flox and Ets2db2/db2 subpopulations post AdCreGFP infection. Ets2flox/flox and Ets2db2/db2 cells at each time point calculated based on the PCR result: No. of Ets2flox/flox cells = total cell No. x %flox; No. of Ets2db2/db2 cells = total cell No. x %db2. The doubling time for each group, calculated according to the trend line equations, were 29.4 h (mock infected), 30.2 h (AdGFP-infected), 34.1 h (total AdCreGFP-infected), 27.2 h (Ets2flox/flox subpopulation post AdCreGFP infection), and 61.8 h (Ets2db2/db2 subpopulation post AdCreGFP infection). Similar results were obtained from 5 separate experiments with three independent clones.
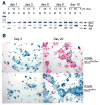
Figure 4. Ets2flox/flox TS cell specific selection
(A) Semi-quantitative PCR analysis of Ets2 alleles in three TS clones: R26R;Ets2flox/wt (a), R26R;Ets2flox/flox (b), and Ets2flox/wt (c) after AdCreGFP infection at the same MOI. The indicated percentages of Ets2flox/(Ets2db2 + Ets2flox) in each clone at indicated time points were calculated from a standard curve. Note the increase of the Ets2flox band in the homozygous TS clone b. (B) TS cells of indicated genotypes were infected with AdCreGFP and replated at 3 dpi (day 0). Cells were cultured in GM for indicated period prior to staining for β-galactosidase (blue). Upper panels show the virtual disappearance of β-galactosidase positive (blue) cells after 20 days of culture in the Ets2flox/flox TS cells. Unrecombined cells were visualized by nuclear fast red counterstain.
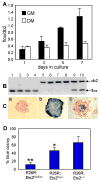
Figure 5. Ets2 dependent TS cell self-renewal
(A) Ets2flox/flox TS cells were cultured either in GM or DM following AdCreGFP infection. Purified DNA samples from indicated time points were analyzed by real-time PCR using primers specific for Ets2flox and Ets2db2. Values represent means ± SEM of three separate experiments. (B and C) Coordinate recombination of Ets2flox and R26R Cre reporter gene. Colonies from AdCreGFP-infected Ets2flox/flox TS cells were stained for β-galactosidase activity and counterstained with nuclear fast red. A representative negative (red), positive (blue) and mixed colony was shown in panel a, b and c, respectively (C). The stained colonies were recovered and analyzed by PCR. The results for 4 red colonies (lanes1-4), 4 blue colonies (lanes 5-8) and 2 mixed colonies (lanes 9-10) are shown (B). Mixed colonies were not scored for the analysis shown in panel D. (D) Colony formation by the recombined cells, indicated by the percentage of blue colonies, was dramatically reduced in the homozygous TS cells. More than 200 colonies were counted from multiple dishes for each genotype. Values represent means + SD of three independent experiments. Statistically significant differences are indicated: * = P < 0.05; ** = P < 0.01, by t test.
Figure 6. Ets2 dependent gene expression in Ets2flox/flox TS cells
RNAs from two or three independently isolated Ets2flox/flox TS cell lines under four conditions: normal growth medium (GM); in differentiation medium (DM); in GM after infection with AdCreGFP or in GM after infection with AdGFP virus were analyzed by cDNA hybridization to Illumina mouse oligonucleotide arrays. Signal output was analyzed by BeadStudio software. (A) Unsupervised cluster analysis of individual samples shows that replicate individual samples grown in the same medium were similar. Note that RNAs from DM and mouse embryo fibroblasts (MEF) were distinct from cells grown in GM regardless of infection with AdCreGFP or AdGFP virus. (B) Cluster analysis of grouped samples. Results of multiple samples of the same growth and virus conditions were compared for overall similarity by the unsupervised clustering analysis. RNAs from TS cells infected with AdCreGFP or AdGFP were more similar to uninfected TS cells (GM) than cells grown for four days in DM. DM samples were divided into two groups because of the use of Sentrix mouse-6 (24k gene) and mouse-8 (16k gene) chips. (C) Venn diagram representation of overlap of genes most changed during differentiation (GM vs DM) and after infection with AdCreGFP virus (GM ±Ets2). Normalized data of the four groups was analyzed with GeneSpring software. Lists were generated using the same P value threshold for differentially expressed gene sets. 89 of the top 100 genes sensitive to infection with AdCreGFP also changed significantly when TS cells were shifted from GM to DM for four days.
Figure 7. Ets2 dependent gene expression
(A) Differences in expression of nine selected genes decreased three days after AdCreGFP infection (Table S1) and known regulators of TS cell or ES cell self renewal are compared to changes in expression of the same genes after 4 days in DM. Ratios of cells infected with Cre virus and control GFP virus are shown as log base 2. All values represent grouped and normalized replicates. (B) Time dependence of selected gene expression. Individual points represent fold difference between Ets2flox/flox TS cells grown for the indicated time after infection with AdCreGFP relative to control cells infected with AdGFP. These values were evaluated in Bead Studio software, normalized to companion samples infected with AdGFP. (C) Expression of Fgfr2, Furin and Elf5 RNAs is not sensitive to AdCreGFP infection.
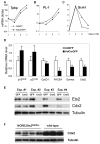
Figure 8. Molecular changes in Ets2 deficient TS cultures and colon tissues
(A-C) Adeno-infected Ets2flox/flox TS cells were induced to differentiate after dissociation and replating at equal density at 3 dpi. RNA was isolated every 2 days, and expression of specific mRNAs was quantified by real-time PCR. The results are expressed as fold induction relative to the levels in regular GM culture. Note the logarithmic scale in panel A and B. Similar results were obtained in at least three independent experiments. (D) mRNAs were isolated from three independent Ets2flox/flox TS clones infected with indicated adenoviruses and cultured in GM for 3-4 days. Expression of specific transcripts was quantified with reverse transcription and real-time PCR. Values represent means + SEM normalized relative to the AdGFP-infected controls. The differences are statistically significant by t test (one-tail paired, P<0.05). (E) Endogenous Cdx2, Ets2 and tubulin proteins in cell lysates from TS cultures infected with indicated adenoviruses were detected by SDS-PAGE and immunoblotting. (F) Cdx2 and tubulin protein levels in colon tissues from four “waved” MORE;Ets2db2/flox mice and 3 wild-type mice.
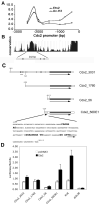
Figure 9. Ets2 regulation of Cdx2 transcription
(A) Quantitative PCR analysis of ChIP for Ets2 and acetylated histone H3 (Ac-H3) enrichment relative to non-specific rabbit IgG binding over the 3 kb upstream region of mouse Cdx2 gene. Ets2 is bound to a distal region but not the proximal promoter. Ac-H3 is enriched over both regions. (B) Sequence conservation of the Cdx2 upstream region among mouse, rat, human and dog (
). (C) Schematic of luciferase reporter constructs (filled line with arrow): Cdx2_3031, nt -3031 to +73 region of the mouse Cdx2 gene. The hatched region and line indicate the location of the 242 bp conserved region in B and as shown for construct Cdx2_56DE1 below. Vertical lines within the flanking region indicate potential Ets binding sites. Cdx2_1760 represents the 1.7 kb Cdx2 promoter lacking the distal region. Cdx2_56 indicates the minimal Cdx2 promoter from -56 to +73. Cdx2_56DE1 represents the minimal promoter with the additional distel element of 242 bp. The sequence of the DE1 is shown with three potential Ets binding elements highlighted. An arrow indicates an overlapping potential AP1 site. (D) Activation of reporters by co-expressed Ets2. Caco-2 cells were transfected with indicated reporter gene and an Ets2 expression vector or a control plasmid (pcDNA3) and the Renilla luciferase transfection control plasmid. The E18, synthetic Ets responsive reporter (Galang et al., 1994) and pGL3B, a control reporter plasmid without a promoter represent positive and negative controls. Values represent means ± SD of three independent experiments. Values represent the ratio of firefly luciferase activity to the control Renilla luciferase activity.
Similar articles
- New insights for Ets2 function in trophoblast using lentivirus-mediated gene knockdown in trophoblast stem cells.
Odiatis C, Georgiades P. Odiatis C, et al. Placenta. 2010 Jul;31(7):630-40. doi: 10.1016/j.placenta.2010.05.001. Epub 2010 May 31. Placenta. 2010. PMID: 20569982 - Ets2-dependent trophoblast signalling is required for gastrulation progression after primitive streak initiation.
Polydorou C, Georgiades P. Polydorou C, et al. Nat Commun. 2013;4:1658. doi: 10.1038/ncomms2646. Nat Commun. 2013. PMID: 23552073 - SATB1 promotion of trophoblast stem cell renewal through regulation of threonine dehydrogenase.
Kubota K, Iqbal K, Soares MJ. Kubota K, et al. Biochim Biophys Acta Gen Subj. 2021 Jan;1865(1):129757. doi: 10.1016/j.bbagen.2020.129757. Epub 2020 Oct 1. Biochim Biophys Acta Gen Subj. 2021. PMID: 33011339 Free PMC article. - Ets transcription factors and targets in osteogenesis.
Raouf A, Seth A. Raouf A, et al. Oncogene. 2000 Dec 18;19(55):6455-63. doi: 10.1038/sj.onc.1204037. Oncogene. 2000. PMID: 11175361 Review. - Tracking the intermediate stages of epithelial-mesenchymal transition in epithelial stem cells and cancer.
Jordan NV, Johnson GL, Abell AN. Jordan NV, et al. Cell Cycle. 2011 Sep 1;10(17):2865-73. doi: 10.4161/cc.10.17.17188. Epub 2011 Sep 1. Cell Cycle. 2011. PMID: 21862874 Free PMC article. Review.
Cited by
- Transcriptional regulators of the trophoblast lineage in mammals with hemochorial placentation.
Knott JG, Paul S. Knott JG, et al. Reproduction. 2014 Dec;148(6):R121-36. doi: 10.1530/REP-14-0072. Epub 2014 Sep 4. Reproduction. 2014. PMID: 25190503 Free PMC article. Review. - Super-Enhancers in Placental Development and Diseases.
Rosario GX, Brown S, Karmakar S, Rumi MAK, Nayak NR. Rosario GX, et al. J Dev Biol. 2025 Apr 9;13(2):11. doi: 10.3390/jdb13020011. J Dev Biol. 2025. PMID: 40265369 Free PMC article. Review. - Cellular Dynamics of Mouse Trophoblast Stem Cells: Identification of a Persistent Stem Cell Type.
Motomura K, Oikawa M, Hirose M, Honda A, Togayachi S, Miyoshi H, Ohinata Y, Sugimoto M, Abe K, Inoue K, Ogura A. Motomura K, et al. Biol Reprod. 2016 Jun;94(6):122. doi: 10.1095/biolreprod.115.137125. Epub 2016 Apr 27. Biol Reprod. 2016. PMID: 27122635 Free PMC article. - Relevance of HCN2-expressing human mesenchymal stem cells for the generation of biological pacemakers.
Bruzauskaite I, Bironaite D, Bagdonas E, Skeberdis VA, Denkovskij J, Tamulevicius T, Uvarovas V, Bernotiene E. Bruzauskaite I, et al. Stem Cell Res Ther. 2016 Apr 30;7(1):67. doi: 10.1186/s13287-016-0326-z. Stem Cell Res Ther. 2016. PMID: 27137910 Free PMC article. - Ets1 and Ets2 are required for endothelial cell survival during embryonic angiogenesis.
Wei G, Srinivasan R, Cantemir-Stone CZ, Sharma SM, Santhanam R, Weinstein M, Muthusamy N, Man AK, Oshima RG, Leone G, Ostrowski MC. Wei G, et al. Blood. 2009 Jul 30;114(5):1123-30. doi: 10.1182/blood-2009-03-211391. Epub 2009 May 1. Blood. 2009. PMID: 19411629 Free PMC article.
References
- Anson-Cartwright L, Dawson K, Holmyard D, Fisher SJ, Lazzarini RA, Cross JC. The glial cells missing-1 protein is essential for branching morphogenesis in the chorioallantoic placenta. Nat Genet. 2000;25:311–4. - PubMed
- Beck S, Le Good JA, Guzman M, Ben Haim N, Roy K, Beermann F, Constam DB. Extraembryonic proteases regulate Nodal signalling during gastrulation. Nat Cell Biol. 2002;4:981–5. - PubMed
- Brunner D, Ducker K, Oellers N, Hafen E, Scholz H, Klambt C. The ETS domain protein pointed-P2 is a target of MAP kinase in the sevenless signal transduction pathway. Nature. 1994;370:386–9. - PubMed
- Buchholz F, Angrand PO, Stewart AF. Improved properties of FLP recombinase evolved by cycling mutagenesis. Nat Biotechnol. 1998;16:657–62. - PubMed
Publication types
MeSH terms
Substances
LinkOut - more resources
Full Text Sources
Medical
Molecular Biology Databases
Research Materials

