The transcriptome and metabolic gene signature of protoplasmic astrocytes in the adult murine cortex - PubMed (original) (raw)
Comparative Study
. 2007 Nov 7;27(45):12255-66.
doi: 10.1523/JNEUROSCI.3404-07.2007.
Ursula Sonnewald, Helle S Waagepetersen, Arne Schousboe, Wei He, Jane H-C Lin, Xiaoning Han, Takahiro Takano, Su Wang, Fraser J Sim, Steven A Goldman, Maiken Nedergaard
Affiliations
- PMID: 17989291
- PMCID: PMC6673251
- DOI: 10.1523/JNEUROSCI.3404-07.2007
Comparative Study
The transcriptome and metabolic gene signature of protoplasmic astrocytes in the adult murine cortex
Ditte Lovatt et al. J Neurosci. 2007.
Abstract
Protoplasmic astrocytes are critically important to energy metabolism in the CNS. Our current understanding of the metabolic interactions between neurons and glia is based on studies using cultured cells, from which mainly inferential conclusions have been drawn as to the relative roles of neurons and glia in brain metabolism. In this study, we used functional genomics to establish the relative compartmentalization of neuronal and astrocytic metabolic pathways in the adult brain. To this end, fluorescence-activated cell sorting was used to directly isolate neurons and protoplasmic astrocytes from the cortex of adult mice. Microarray analysis showed that astrocytes and neurons each express transcripts predicting individual self-sufficiency in both glycolysis and oxidative metabolism. Surprisingly, most enzymes in the tricarboxylic acid (TCA) cycle were expressed at higher relative levels in astrocytes than in neurons. Mass spectrometric analysis of the TCA cycle intermediates confirmed that freshly isolated adult astrocytes maintained an active TCA cycle, whereas immuno-electron microscopy revealed that fine astrocytic processes encompassing synapses contained a higher density of mitochondria than surrounding cells. These observations indicate that astrocytes exhibit robust oxidative metabolism in the intact adult brain and suggest a prominent contribution of astrocytic metabolism to functional brain imaging, including BOLD (blood-oxygen level-dependent) functional magnetic resonance imaging signals.
Figures
Figure 1.
Schematic outline of FACS procedure and microarray analysis. Left, Gfap-GFP-positive cortices (left image) were dissociated, immunolabeled with rbGLT1-PE, and purified by FACS into three populations: GLT1+/Gfap-GFP+, GLT1+/Gfap-GFP−, and GLT1−/Gfap-GFP− based on sequentially gating of size (FSC-SSC plot), viability (PI), and Gfap-GFP and rbGLT1-PE fluorescence. Right, Thy1-YFP-positive cortices (right image) were dissociated and immunolabeled with rbGLT1-PE, and GLT1−/Thy-YFP+ neurons were purified by FACS using a similar approach as above. After FACS, RNA was extracted from all the purified populations for microarray analysis. Bottom, Small aliquots of the FACS-purified populations were assayed for purity and specificity by immunocytochemistry. Cells were immunolabeled with guinea pig anti-GLT1 (red) and mouse anti-AQP4 (white) to confirm the astrocytic phenotype, whereas all nuclei labeled with DAPI (4′,6-diamidino-2-phenylindole) (blue). Only the GLT1+/Gfap-GFP+ population was GFP+ (green). The GLT1+/Gfap-GFP+ population had 97.3 ± 0.3% GLT1+ cells, the GLT1+/Gfap-GFP− population had 96.0 ± 1.6% GLT1+ cells, and the GLT1−/Gfap-GFP− population had 1.0 ± 0.4% GLT1+ cells (n = 3 biological replicates; mean ± SEM). GLT1−/Thy1-YFP+-purified cells were immunolabeled with mouse anti-MAP2 (white) and 97 ± 4% labeled with MAP2, confirming the neuronal phenotype.
Figure 2.
Validation of custom-made rabbit anti-GLT1 antibody. A, Western blot analysis of the rabbit anti-GLT1 antibody (1:250) was performed on 5 μg of protein extracted from adult mouse cortex. Only one band of the expected size of ∼62 kDa was observed in the lane. B–D, Custom-made rabbit anti-GLT1 antibody stained in an identical manner as commercial guinea pig anti-GLT1 antibody. Cryosections of perfusion-fixed adult mouse brain were used for immunohistochemistry. Sections were incubated with rabbit anti-GLT1and guinea pig anti-GLT1 for double immunolabeling, followed by donkey anti-rabbit FITC and anti-guinea pig Cy3 labeling. Sections were visualized using a fluorescence microscope (IX70; Olympus). F–I, GFAP, Gfap-GFP, and GLT1 coexpression patterns; all GFAP-defined astrocytes were GFP and GLT1 positive, whereas only some GLT1-positive astrocytes were GFAP or GFP positive. Vibratome sections from perfusion-fixed adult mouse GFAP–GFP brain was used for immunohistochemistry. Sections were incubated with mouse anti-GFAP and guinea pig anti-GLT1 followed by anti-guinea pig Cy3 and anti-mouse Cy5 labeling. Sections were visualized using a confocal microscope (FV500; Olympus). Scale bars: F, 50 μm; J, 40 μm. DAPI, 4′,6-diamidino-2-phenylindole.
Figure 3.
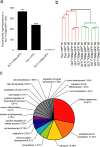
Generation of an astrocyte-enriched gene expression set. a, Reverse transcription qPCR on purified RNA showed that Aqp4 expression was enriched 364-fold in the GLT1+/Gfap-GFP+ group compared with the GLT1−/Gfap-GFP− group (**p = 0.0011) and 236-fold compared with the Thy1+ neuron group (***p < 0.0001); however, Aqp4 was only twofold higher in GLT1+/Gfap-GFP+ astrocytes compared with GLT1+/Gfap-GFP− astrocytes (p = 0.069, paired Student's t test; mean ± SEM). b, Similarity of groups was compared using MAS5 normalized and filtered data (19,369 probe sets) by hierarchical clustering of the Euclidean average distances (n = 3 biological samples per group). The GLT1+/Gfap-GFP+ and GLT1+/Gfap-GFP− groups were the two most similar. c, Categorizing GO terms of the biological functions associated with the astrocyte-enriched genes (924 probe sets) were analyzed in DAVID 2007 (
/), and the relative proportions were presented in a pie chart (functional annotation threshold; count >10; p < 0.05; FDR cutoff 5%). Three genes from each of the five major and least similar GO term groups are presented in Table 2.
Figure 4.
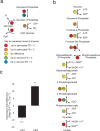
Expression of glycogenic and glycolytic enzymes is enhanced in astrocytes. a, b, Microarray analysis of the expression fold difference in glycogenic and glycolytic enzymes between GLT1+/Gfap-GFP−/+ astrocytes (n = 6) and Thy1+ neurons (n = 3). The number- and color-coded circles indicate an enzyme (number) and the expression level (color) of that specific enzyme. The coding is indicated in the key; enzymes labeled “No difference” were not significantly different between astrocytes and neurons. “Up in astrocytes” and “Up in neurons” indicate a significantly increased fold difference (FD) in the gene expression in astrocytes relative to neurons and in neurons relative to astrocytes, respectively (unpaired two-sided Student's t test, corrected p < 0.05). a, Key to enzymes in the glycogen synthesis and breakdown pathways: 1a, Pgm2l1 and Pgm5; 1b, Pgm2; 2, Ugp2; 3, Gys1; 4, Pygb, Pygl, and Pygm. b, Key to enzymes in the glycolysis pathway: 1, Hk1 and Hk2; 2, Gpi1; 3a, Pfkm and Pfkp; 3b, Pfkl; 4a, Aldoa; 4b, Aldoc; 5, Tpi; 6, G6pdx; 7, Pgk1; 8a, Pgam1; 8b, Bpgm; 9a, Eno1; 9b, Eno2; 10, Pkm2; 11, Ldhb. c, The histograms show the expression fold difference of Ldha and Ldhb assessed by qPCR between Gfap-GFP+ astrocytes and Thy1+ neurons. **p < 0.01; ***p < 0.001. n = 3 biological independent, unpaired two-sided Student's t test; mean ± SEM.
Figure 5.
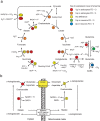
Microarray analysis of the expression fold difference in TCA cycle and aspartate–malate shuttle enzymes between GLT1+/Gfap-GFP−/+ astrocytes (n = 6) and Thy1+ neurons (n = 3). The number- and color-coded circles indicate an enzyme (number) and the expression level (color) of that specific enzyme. The coding is indicated in the key; enzymes labeled “No difference” were not significantly different between astrocytes and neurons. “Up in astrocytes” and “Up in neurons” indicate a significantly increased fold difference (FD) in the gene expression in astrocytes relative to neurons and in neurons relative to astrocytes, respectively (unpaired two-sided Student's t test, corrected p < 0.05). a, Key to TCA cycle enzymes: 1, Cs; 2, Aco1 and Aco2; 3a, Idh3b and Idh3g; 3b, Idh3a; 4, Ogdh and Dlst; 5a, Suclg1 and Suclg2; 5b, Sucla2; 6a, Sdha and Sdhb; 6b, Sdhc; 6c, Sdhd; 7, Fh1; 8a, Mdh1; 8b, Mdh2; 9, Glud1; 10, Glul; 11, Gls; 12, Gad1; 14, Pcx; 15a, Me2; 15b, Mod1. b, Key to NADH shuttle pathway: 1, Got1; 2, Got2; 3, Mdh1; 4, Mdh2.
Figure 6.
Electron microscopy images of mitochondria in astrocytic processes. Cortical sections were prepared from GFAP–GFP mice and immunolabeled against GFP. GFP-positive astrocytes throughout the cortical layers were evaluated. a–c, Representative EM images of different sizes in astrocytic processes immunolabeled against GFP. GFP+ astrocytic mitochondria are indicated with white arrowheads, and nonastrocytic mitochondria are indicated with black arrowheads. Note a relative higher number of astrocytes in astrocytic processes compared with surrounding neuropil. Scale bars: a, 1 μm; b, 0.5 μm; c, 0.5 μm. d, Plot of the relative density of astrocytic mitochondria compared the density of mitochondria in the surrounding neuropil. The relative density of mitochondria was defined as number of mitochondria in astrocytic processes (defined by the staining for GFP) versus the relative number of mitochondria in rest of the section (not stained for GFP). The relative density of mitochondria was quantified in a total of 23 sections from three animals. e, Comparison of the mean of the density of mitochondria in and outside GFP-positive astrocytic (AS) processes in the same sections plotted in d (Student's t test).
Similar articles
- Expression of the human isoform of glutamate dehydrogenase, hGDH2, augments TCA cycle capacity and oxidative metabolism of glutamate during glucose deprivation in astrocytes.
Nissen JD, Lykke K, Bryk J, Stridh MH, Zaganas I, Skytt DM, Schousboe A, Bak LK, Enard W, Pääbo S, Waagepetersen HS. Nissen JD, et al. Glia. 2017 Mar;65(3):474-488. doi: 10.1002/glia.23105. Epub 2016 Dec 29. Glia. 2017. PMID: 28032919 - Trafficking between glia and neurons of TCA cycle intermediates and related metabolites.
Schousboe A, Westergaard N, Waagepetersen HS, Larsson OM, Bakken IJ, Sonnewald U. Schousboe A, et al. Glia. 1997 Sep;21(1):99-105. Glia. 1997. PMID: 9298852 - [U-13C] aspartate metabolism in cultured cortical astrocytes and cerebellar granule neurons studied by NMR spectroscopy.
Bakken IJ, White LR, Aasly J, Unsgård G, Sonnewald U. Bakken IJ, et al. Glia. 1998 Jul;23(3):271-7. doi: 10.1002/(sici)1098-1136(199807)23:3<271::aid-glia9>3.0.co;2-7. Glia. 1998. PMID: 9633811 - Intercellular metabolic compartmentation in the brain: past, present and future.
Hertz L. Hertz L. Neurochem Int. 2004 Jul-Aug;45(2-3):285-96. doi: 10.1016/j.neuint.2003.08.016. Neurochem Int. 2004. PMID: 15145544 Review. - Cellular mechanisms of brain energy metabolism and their relevance to functional brain imaging.
Magistretti PJ, Pellerin L. Magistretti PJ, et al. Philos Trans R Soc Lond B Biol Sci. 1999 Jul 29;354(1387):1155-63. doi: 10.1098/rstb.1999.0471. Philos Trans R Soc Lond B Biol Sci. 1999. PMID: 10466143 Free PMC article. Review.
Cited by
- Glial cells in (patho)physiology.
Parpura V, Heneka MT, Montana V, Oliet SH, Schousboe A, Haydon PG, Stout RF Jr, Spray DC, Reichenbach A, Pannicke T, Pekny M, Pekna M, Zorec R, Verkhratsky A. Parpura V, et al. J Neurochem. 2012 Apr;121(1):4-27. doi: 10.1111/j.1471-4159.2012.07664.x. Epub 2012 Feb 2. J Neurochem. 2012. PMID: 22251135 Free PMC article. Review. - Morphological plasticity of astroglia: Understanding synaptic microenvironment.
Heller JP, Rusakov DA. Heller JP, et al. Glia. 2015 Dec;63(12):2133-51. doi: 10.1002/glia.22821. Epub 2015 Mar 18. Glia. 2015. PMID: 25782611 Free PMC article. Review. - Brain lactate metabolism: the discoveries and the controversies.
Dienel GA. Dienel GA. J Cereb Blood Flow Metab. 2012 Jul;32(7):1107-38. doi: 10.1038/jcbfm.2011.175. Epub 2011 Dec 21. J Cereb Blood Flow Metab. 2012. PMID: 22186669 Free PMC article. Review. - Hyperglycemia Alters Astrocyte Metabolism and Inhibits Astrocyte Proliferation.
Li W, Roy Choudhury G, Winters A, Prah J, Lin W, Liu R, Yang SH. Li W, et al. Aging Dis. 2018 Aug 1;9(4):674-684. doi: 10.14336/AD.2017.1208. eCollection 2018 Aug. Aging Dis. 2018. PMID: 30090655 Free PMC article. - Functions of astrocytes and their potential as therapeutic targets.
Kimelberg HK, Nedergaard M. Kimelberg HK, et al. Neurotherapeutics. 2010 Oct;7(4):338-53. doi: 10.1016/j.nurt.2010.07.006. Neurotherapeutics. 2010. PMID: 20880499 Free PMC article. Review.
References
- Attwell D, Laughlin SB. An energy budget for signaling in the grey matter of the brain. J Cereb Blood Flow Metab. 2001;21:1133–1145. - PubMed
- Bak LK, Schousboe A, Sonnewald U, Waagepetersen HS. Glucose is necessary to maintain neurotransmitter homeostasis during synaptic activity in cultured glutamatergic neurons. J Cereb Blood Flow Metab. 2006;26:1285–1297. - PubMed
- Berg JM, Tymoczko JL, Stryer L. Biochemistry. Ed 5. New York: W. H. Freeman; 2002.
Publication types
MeSH terms
LinkOut - more resources
Full Text Sources
Other Literature Sources


