Sox3 expression is maintained by FGF signaling and restricted to the neural plate by Vent proteins in the Xenopus embryo - PubMed (original) (raw)
Sox3 expression is maintained by FGF signaling and restricted to the neural plate by Vent proteins in the Xenopus embryo
Crystal D Rogers et al. Dev Biol. 2008.
Abstract
The formation of the nervous system is initiated when ectodermal cells adopt the neural fate. Studies in Xenopus demonstrate that inhibition of BMP results in the formation of neural tissue. However, the molecular mechanism driving the expression of early neural genes in response to this inhibition is unknown. Moreover, controversy remains regarding the sufficiency of BMP inhibition for neural induction. To address these questions, we performed a detailed analysis of the regulation of the soxB1 gene, sox3, one of the earliest genes expressed in the neuroectoderm. Using ectodermal explant assays, we analyzed the role of BMP, Wnt and FGF signaling in the regulation of sox3 and the closely related soxB1 gene, sox2. Our results demonstrate that both sox3 and sox2 are induced in response to BMP antagonism, but by distinct mechanisms and that the activation of both genes is independent of FGF signaling. However, both require FGF for the maintenance of their expression. Finally, sox3 genomic elements were identified and characterized and an element required for BMP-mediated repression via Vent proteins was identified through the use of transgenesis and computational analysis. Interestingly, none of the elements required for sox3 expression were identified in the sox2 locus. Together our data indicate that two closely related genes have unique mechanisms of gene regulation at the onset of neural development.
Figures
Fig. 1. Comparison of sox3 and sox2 expression in whole embryos and ectodermal explants
(A) Temporal expression of sox3 and sox2 in whole embryos examined by RT-PCR. ODC is used as a loading control. RT- is no reverse transcriptase and E is egg. (B) WISH analysis of sox3 and sox2 expression in cleavage (stage 6), blastula (stage 9), gastrula (stage 10–12.5) and neurula (stage 18) embryos. Stage 6–10 embryos are viewed from the animal pole with dorsal to the right, stage 10.5 and 12.5 embryos from the vegetal pole with dorsal to the top, and stage 18 embryos from dorsal side with anterior to the top. The arrowhead and asterisk mark the midline and otic placode, respectively. (C) Expression of sox3 and sox2 in animal ectodermal explants isolated from uninjected embryos and embryos injected with noggin mRNA (indicated by +).
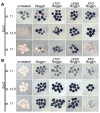
Fig. 2. FGF is required for the maintenance but not the induction of sox2 and sox3 expression in ectodermal explants
Expression of (A) sox3 and (B) sox2 in animal ectodermal explants as revealed by WISH. Explants were excised between stages 8–9 from untreated embryos or those injected at the 1-cell stage with mRNA for Noggin alone, Noggin plus ΔTCF3, Noggin plus ΔXfz8 or Noggin plus XFD mRNA. Explants were cultured until early gastrula (stage 10.5/11), late gastrula (stage 12.5) or neurula (stage 17) stage as determined by whole embryo controls.
Fig. 3. Sox3 inhibition by BMP and sox2 induction by Noggin require de novo protein synthesis
Expression of (A) sox3 and (B) sox2 in ectodermal explants revealed by WISH. Explants were excised at stage 8–9 from untreated embryos or embryos injected with noggin mRNA at the 1-cell stage. Explants were incubated with or without BMP protein and/or cycloheximide (CHX) as indicated at the top of each row. Explants were collected at early gastrula (stage 10.5), late gastrula (stage 12.5) or neurula (stage 17) as indicated to the left. The whole embryo control by which the stage was determined is in the column on the far right.
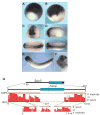
Fig. 4. A 1.55 kb Xlsox3 upstream regulatory region is partially conserved in X. tropicalis and mimics endogenous sox3 expression
(A–F) WISH of transgenic embryos expressing the _Xlsox3 –_GFP reporter construct. (A) Vegetal view of a stage 10.5 and (B) stage 12 embryo with dorsal to the top. (C) Anterior view of a stage 21 embryo on top with a dorsal view of the same embryo directly below. (D) Lateral view of a stage 24 embryo with a dorsal view of the same embryo directly below. (E) Dorsal view of a stage 27 embryo. (F) Lateral view of the head of a stage 33 embryo. The line represents the sox3 upstream regulatory region and −1.55 represents the distance in kb from the ATG. The green box represents the EGFP coding region and the black box the SV40 polyA region. (G) Evolutionary conserved regions between X. laevis and X. tropicalis sox3. A diagram of the sox3 regulatory region used in (A–F) is at the top with a percent identity plot (pip) of Xlsox3 aligned to a homologous region of Xtsox3 below it. At the bottom is a pip of _Xt_sox3 aligned to Xlsox3. The blue box represents a 484 bp region in X. laevis which does not align to the Xtsox3 sequence. The gray box represents a 30 bp region which is conserved between mouse and Xlsox3. The X-axis of the pip is the length of the sequence in bases or kilobases as designated. The Y-axis spans 50–100% nucleotide identify with the light horizontal line in the center representing 75% nucleotide identity. The red regions under the curve represent evolutionary conserved blocks. Two large blocks of the Xlsox3 upstream regulatory region align with Xtsox3. In Xtsox3, the first block (farthest from the ATG) is split into two blocks.
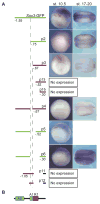
Fig. 5. A 74 bp region is required for expression of _sox3_-GFP
WISH for GFP expression in gastrula (stage 10.5) and neurula (stage 17–20) transgenic embryos containing _sox3-_GFP or deletions. (A) Diagrams of 5′ end and internal deletions of the sox3 upstream regulatory region are labeled p1-6, 11, 12, 15 and 16. The region included in the construct is indicated by a bar and deletions by the absence of this bar. A red bar denotes no expression of GFP, while a green bar marks those constructs that drive GFP expression. Numbers indicate the deletion end points with the left dashed vertical line marking 746 bp upstream of the ATG and the right dashed line marking 672 bp upstream. (B) A model summarizing the data. The region between −672 bp and −746 bp (green A2, activator 2) is required for expression except when R1 (repressor module) is deleted. In the absence of A2 and R1, a region between −746 bp and −1.55 kb (A1) is required for expression. The total numbers of embryos with the expression pattern shown and the relative levels of expression are in Table S1.
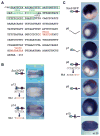
Fig. 6. Identification of transcription factor binding sites required for regulation of _sox3-_GFP expression
(A) Sequence of regulatory elements and putative transcription factor binding sites. The boxed region is the putative activator module, A2, which is deleted in p4. The remaining sequence is the putative repressor module, R1 which is deleted in p7. The entire region in A plus sequences up to −299 are deleted in p6. Putative forkhead (FKHD) binding sites are labeled in green and putative Vent1 and Vent2 sites are in red. (B) WISH of transgenic embryos (stage 17–20) expressing _sox3-_GFP constructs. Embryos are a dorsal view with anterior to the right. A diagram of the upstream regulatory region shown in A is on the left. The numbers in the lower right hand corner refer to the number of embryos with the expression pattern shown over the total number of embryos. (C) WISH of transgenic embryos (stage 12) expressing _sox3-_GFP constructs. Embryos are a vegetal view with dorsal to the top. An inverted triangle indicates a deletion and an X indicates that a site has been mutated. The total numbers of embryos with the expression pattern shown are in Table 1. Putative TF sites from panel A are represented schematically in the same colors: green circle, Fkhd; red hexagon, Vent1 and Vent2.
Fig. 7. Vent1 and Vent2 repress sox3 and _sox3_-GFP expression
(A) Animal pole view of WISH for GFP in stage 12.5 embryos injected at the 1-cell stage with 50 pg _sox3_-GFP DNA or 50 pg of p10 DNA (V1 and V2 sites mutated), lacZ mRNA as a tracer (light blue) and vent (V1), vent2 (V2), VPvent1 (VPV1) or VPvent2 (VPV2) mRNA. (B) WISH of sox3 in stage 12.5 embryos injected with lacZ mRNA and vent mRNA as indicated. One of 32-cells was injected with V1 or V2 mRNA and 1 of 2-cells was injected with VPV1 or VPV2 mRNA. Embryos are a dorsal view. The numbers in the right hand corner are the number of embryos with the same phenotype as that shown over the total number of embryos. (C) RT-PCR using primers to sox3, geminin or ODC as a loading control of either uninjected ectodermal explants or those injected with noggin, V1, V2, V1+V2, VPV1 and/or VPV2 mRNA.
Similar articles
- Xenopus Sox3 activates sox2 and geminin and indirectly represses Xvent2 expression to induce neural progenitor formation at the expense of non-neural ectodermal derivatives.
Rogers CD, Harafuji N, Archer T, Cunningham DD, Casey ES. Rogers CD, et al. Mech Dev. 2009 Jan-Feb;126(1-2):42-55. doi: 10.1016/j.mod.2008.10.005. Epub 2008 Oct 17. Mech Dev. 2009. PMID: 18992330 Free PMC article. - BMP antagonists and FGF signaling contribute to different domains of the neural plate in Xenopus.
Wills AE, Choi VM, Bennett MJ, Khokha MK, Harland RM. Wills AE, et al. Dev Biol. 2010 Jan 15;337(2):335-50. doi: 10.1016/j.ydbio.2009.11.008. Epub 2009 Nov 10. Dev Biol. 2010. PMID: 19913009 Free PMC article. - Neural induction requires BMP inhibition only as a late step, and involves signals other than FGF and Wnt antagonists.
Linker C, Stern CD. Linker C, et al. Development. 2004 Nov;131(22):5671-81. doi: 10.1242/dev.01445. Development. 2004. PMID: 15509767 - Pathways regulating lens induction in the mouse.
Lang RA. Lang RA. Int J Dev Biol. 2004;48(8-9):783-91. doi: 10.1387/ijdb.041903rl. Int J Dev Biol. 2004. PMID: 15558471 Review. - Interplay of Pax6 and SOX2 in lens development as a paradigm of genetic switch mechanisms for cell differentiation.
Kondoh H, Uchikawa M, Kamachi Y. Kondoh H, et al. Int J Dev Biol. 2004;48(8-9):819-27. doi: 10.1387/ijdb.041868hk. Int J Dev Biol. 2004. PMID: 15558474 Review.
Cited by
- Mesoderm induction and patterning: Insights from neuromesodermal progenitors.
Martin BL. Martin BL. Semin Cell Dev Biol. 2022 Jul;127:37-45. doi: 10.1016/j.semcdb.2021.11.010. Epub 2021 Nov 25. Semin Cell Dev Biol. 2022. PMID: 34840081 Free PMC article. Review. - Sox21 regulates the progression of neuronal differentiation in a dose-dependent manner.
Whittington N, Cunningham D, Le TK, De Maria D, Silva EM. Whittington N, et al. Dev Biol. 2015 Jan 15;397(2):237-47. doi: 10.1016/j.ydbio.2014.11.012. Epub 2014 Nov 20. Dev Biol. 2015. PMID: 25448693 Free PMC article. - Neural induction and factors that stabilize a neural fate.
Rogers CD, Moody SA, Casey ES. Rogers CD, et al. Birth Defects Res C Embryo Today. 2009 Sep;87(3):249-62. doi: 10.1002/bdrc.20157. Birth Defects Res C Embryo Today. 2009. PMID: 19750523 Free PMC article. Review. - FGF-dependent midline-derived progenitor cells in hypothalamic infundibular development.
Pearson CA, Ohyama K, Manning L, Aghamohammadzadeh S, Sang H, Placzek M. Pearson CA, et al. Development. 2011 Jun;138(12):2613-24. doi: 10.1242/dev.062794. Development. 2011. PMID: 21610037 Free PMC article. - foxD5 plays a critical upstream role in regulating neural ectodermal fate and the onset of neural differentiation.
Yan B, Neilson KM, Moody SA. Yan B, et al. Dev Biol. 2009 May 1;329(1):80-95. doi: 10.1016/j.ydbio.2009.02.019. Epub 2009 Feb 26. Dev Biol. 2009. PMID: 19250931 Free PMC article.
References
- Amaya E, Musci TJ, Kirschner MW. Expression of a dominant negative mutant of the FGF receptor disrupts mesoderm formation in Xenopus embryos. Cell. 1991;66:257–70. - PubMed
- Bertrand V, Hudson C, Caillol D, Popovici C, Lemaire P. Neural tissue in ascidian embryos is induced by FGF9/16/20, acting via a combination of maternal GATA and Ets transcription factors. Cell. 2003;115:615–27. - PubMed
- Bowles J, Schepers G, Koopman P. Phylogeny of the SOX family of developmental transcription factors based on sequence and structural indicators. Dev Biol. 2000;227:239–55. - PubMed
Publication types
MeSH terms
Substances
LinkOut - more resources
Full Text Sources


