Characterization of the kynurenine pathway in human neurons - PubMed (original) (raw)
Comparative Study
Characterization of the kynurenine pathway in human neurons
Gilles J Guillemin et al. J Neurosci. 2007.
Abstract
The kynurenine pathway is a major route of L-tryptophan catabolism producing neuroactive metabolites implicated in neurodegeneration and immune tolerance. We characterized the kynurenine pathway in human neurons and the human SK-N-SH neuroblastoma cell line and found that the kynurenine pathway enzymes were variably expressed. Picolinic carboxylase was expressed only in primary and some adult neurons but not in SK-N-SH cells. Because of this difference, SK-N-SH cells were able to produce the excitotoxin quinolinic acid, whereas human neurons produced the neuroprotectant picolinic acid. The net result of kynurenine pathway induction in human neurons is therefore predicted to result in neuroprotection, immune regulation, and tumor inhibition, whereas in SK-N-SH cells, it may result in neurotoxicity, immune tolerance, and tumor promotion. This study represents the first comprehensive characterization of the kynurenine pathway in neurons and the first description of the involvement of the kynurenine pathway as a mechanism for controlling both tumor cell neurotoxicity and persistence.
Figures
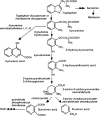
Figure 1.
Simplified diagram of the kynurenine pathway.
Figure 2.
Immunodetection of kynurenine pathway enzymes and products in human neurons and brain. A, B, Cultures of human primary neurons (A) and of SK-N-SH cells (B) were immunostained for the enzymes IDO, TDO, KYNU, KAT-II, KMO, QPRT, and ACMSD, as well as for QUIN and MAP2 as indicated. C, Control preparations of cultures of human primary neurons: irrelevant IgG and nonimmune rabbit serum staining of human primary neurons. D, Human hippocampal sections were also immunostained for IDO, KMO, KYNU, ACMSD, TDO, KAT-II, and QUIN as indicated. Neuronal labeling for all markers was predominantly cytosolic, although occasional staining of proximal processes was seen (e.g., for KMO). Neurons of the hilus (CA4) were the most consistently labeled. Non-neuronal cells were also labeled. Punctate/vesicular labeling of probable microglial cells was widespread in all areas of cortex and hippocampus. QUIN labeling was distinctly granular, as shown in the pyramidal cells of CA1 (D).
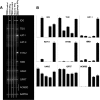
Figure 3.
Detection of kynurenine pathway enzyme expression using RT-PCR. A, Ethidium bromide-stained gels showing RT-PCR for (from top to bottom) IDO, TDO, KAT-I, KAT-II, KYNU, KMO, HAAO, QPRT, ACMSD, and GAPDH expression. The first column corresponds to unstimulated SK-N-SH cells, the second to IFN-γ-stimulated SK-N-SH cells, the third to unstimulated human primary neurons, the fourth to IFN-γ-stimulated human primary neurons, and the fifth to human primary macrophages stimulated with IFN-γ and used as a positive control for kynurenine pathway enzyme expression. B, The histograms indicate the ratio of the expression of the nine kynurenine pathway enzyme mRNA relative to the GAPDH mRNA expression. Individual samples were analyzed in triplicate, and the SEM for all data was determined to be <5%.
Figure 4.
Quantification of kynurenine pathway products by HPLC and GC/MS. A–H, Media samples derived from cultures of SK-N-SH cells and primary neurons either untreated or treated for 24 h with 100 IU/ml IFN-γ (A–D) or at the times indicated (E–H) were analyzed by HPLC for TRP (A), KYN (B), KYNA (C), and 3-HK (D) and by using GC/MS for QUIN (E) and PIC (F, H). Statistical differences comparing the untreated and IFN-γ-treated conditions (A–D) or the change in concentration detected at the 48 or 72 h compared with the 24 h time point are indicated by the asterisks. **p < 0.02 and ***p < 0.01 (Mann–Whitney test).
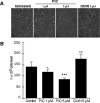
Figure 5.
Effects of PIC and QUIN on SK-H-SH proliferation. A, B, Phase-contrast microscopy of SK-N-SH cell cultures (A) and histogram indicating the number of SK-N-SH cells (from left to right) in control untreated cells and cells treated with either 1 or 5 μ
m
PIC or with 5 μ
m
QUIN 5 for 24 h (B). p values for the comparisons with control condition were determined (Mann–Whitney test): *p < 0.05, **p < 0.01, and ***p < 0.001.
Figure 6.
Scheme indicating differences between human primary neurons and neuroblastoma cells with respect to the production of kynurenine pathway metabolites and their effects in tumor persistence and the immune response.
Similar articles
- Kynurenine pathway metabolism in human blood-brain-barrier cells: implications for immune tolerance and neurotoxicity.
Owe-Young R, Webster NL, Mukhtar M, Pomerantz RJ, Smythe G, Walker D, Armati PJ, Crowe SM, Brew BJ. Owe-Young R, et al. J Neurochem. 2008 May;105(4):1346-57. doi: 10.1111/j.1471-4159.2008.05241.x. Epub 2008 Jan 21. J Neurochem. 2008. PMID: 18221377 - Characterization of the kynurenine pathway in NSC-34 cell line: implications for amyotrophic lateral sclerosis.
Chen Y, Brew BJ, Guillemin GJ. Chen Y, et al. J Neurochem. 2011 Sep;118(5):816-25. doi: 10.1111/j.1471-4159.2010.07159.x. Epub 2011 Jan 28. J Neurochem. 2011. PMID: 21182524 - Research on an in vitro cell system for testing the neurotoxicity of kynurenine pathway metabolites.
Wszelaki N, Melzig MF. Wszelaki N, et al. Pharmazie. 2011 Nov;66(11):899-903. Pharmazie. 2011. PMID: 22204138 - The kynurenine pathway in brain tumor pathogenesis.
Adams S, Braidy N, Bessede A, Brew BJ, Grant R, Teo C, Guillemin GJ. Adams S, et al. Cancer Res. 2012 Nov 15;72(22):5649-57. doi: 10.1158/0008-5472.CAN-12-0549. Epub 2012 Nov 9. Cancer Res. 2012. PMID: 23144293 Review. - Tryptophan, adenosine, neurodegeneration and neuroprotection.
Stone TW, Forrest CM, Mackay GM, Stoy N, Darlington LG. Stone TW, et al. Metab Brain Dis. 2007 Dec;22(3-4):337-52. doi: 10.1007/s11011-007-9064-3. Metab Brain Dis. 2007. PMID: 17712616 Review.
Cited by
- Quinolinic Acid, an endogenous molecule combining excitotoxicity, oxidative stress and other toxic mechanisms.
Pérez-De La Cruz V, Carrillo-Mora P, Santamaría A. Pérez-De La Cruz V, et al. Int J Tryptophan Res. 2012;5:1-8. doi: 10.4137/IJTR.S8158. Epub 2012 Feb 23. Int J Tryptophan Res. 2012. PMID: 22408367 Free PMC article. - The kynurenine pathway and the brain: Challenges, controversies and promises.
Schwarcz R, Stone TW. Schwarcz R, et al. Neuropharmacology. 2017 Jan;112(Pt B):237-247. doi: 10.1016/j.neuropharm.2016.08.003. Epub 2016 Aug 7. Neuropharmacology. 2017. PMID: 27511838 Free PMC article. Review. - Cellular Localization of Kynurenine 3-Monooxygenase in the Brain: Challenging the Dogma.
Sathyasaikumar KV, Pérez de la Cruz V, Pineda B, Vázquez Cervantes GI, Ramírez Ortega D, Donley DW, Severson PL, West BL, Giorgini F, Fox JH, Schwarcz R. Sathyasaikumar KV, et al. Antioxidants (Basel). 2022 Feb 4;11(2):315. doi: 10.3390/antiox11020315. Antioxidants (Basel). 2022. PMID: 35204197 Free PMC article. - Vitamin B6 reduces hippocampal apoptosis in experimental pneumococcal meningitis.
Zysset-Burri DC, Bellac CL, Leib SL, Wittwer M. Zysset-Burri DC, et al. BMC Infect Dis. 2013 Aug 27;13:393. doi: 10.1186/1471-2334-13-393. BMC Infect Dis. 2013. PMID: 23977941 Free PMC article. - A Review of Biomarkers in Mood and Psychotic Disorders: A Dissection of Clinical vs. Preclinical Correlates.
Brand SJ, Moller M, Harvey BH. Brand SJ, et al. Curr Neuropharmacol. 2015;13(3):324-68. doi: 10.2174/1570159x13666150307004545. Curr Neuropharmacol. 2015. PMID: 26411964 Free PMC article. Review.
References
- Bosco MC, Rapisarda A, Massazza S, Melillo G, Young H, Varesio L. The tryptophan catabolite picolinic acid selectively induces the chemokines macrophage inflammatory protein-1alpha and -1beta in macrophages. J Immunol. 2000;164:3283–3291. - PubMed
- Bresjanac M, Antauer G. Reactive astrocytes of the quinolinic acid-lesioned rat striatum express GFRalpha1 as well as GDNF in vivo. Exp Neurol. 2000;164:53–59. - PubMed
- Curatolo L, Caccia C, Speciale C, Raimondi L, Cini M, Marconi M, Molinari A, Schwarcz R. Modulation of extracellular kynurenic acid content by excitatory amino acids in primary cultures of rat astrocytes. Adv Exp Med Biol. 1996;398:273–276. - PubMed
- Curzon G. Brain tryptophan. Normal and disturbed control. Adv Exp Med Biol. 1996;398:27–34. - PubMed
Publication types
MeSH terms
Substances
LinkOut - more resources
Full Text Sources
Other Literature Sources


