PHOSIDA (phosphorylation site database): management, structural and evolutionary investigation, and prediction of phosphosites - PubMed (original) (raw)
PHOSIDA (phosphorylation site database): management, structural and evolutionary investigation, and prediction of phosphosites
Florian Gnad et al. Genome Biol. 2007.
Abstract
PHOSIDA http://www.phosida.com, a phosphorylation site database, integrates thousands of high-confidence in vivo phosphosites identified by mass spectrometry-based proteomics in various species. For each phosphosite, PHOSIDA lists matching kinase motifs, predicted secondary structures, conservation patterns, and its dynamic regulation upon stimulus. Using support vector machines, PHOSIDA also predicts phosphosites.
Figures
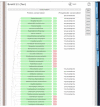
Figure 1
PHOSIDA: phosphorylation site information. For each detected phosphorylation site, the position within the protein sequence along with its surrounding region, maximum assignment localization value, matching kinase motifs, and accessibility is shown. In addition, all detected phosphopeptides that contain the selected phosphosite are displayed along with their corresponding database identification scores, ratios after stimulus, fractions, and occurrences in other proteins.
Figure 2
Accessibilities of phosphorylation sites as calculated by SABLE. The relative accessibility prediction assigns a value between 0 (fully buried) and 9 (fully exposed) to each residue. For phosphoserines, phosphothreonines and phosphotyrosines, accessibility is significantly higher than for their non-phosphorylated counterparts in the same proteins.
Figure 3
Proportion of phosphorylation sites located in loops and hinges as determined by SABLE. In each case, phosphosites are significantly more frequently located in flexible regions.
Figure 4
Proportions of phosphoproteins with orthologs. To examine the conservation of phosphoproteins in comparison to the entire human proteome, we aligned two-directionally against the protein sequences of Saccharomyces cerevisiae, D. melanogaster, D. rerio, Gallus gallus, Bos bovis, Rattus norvegicus and Mus musculus via BLASTP. Phosphoproteins (red) have a much higher likelihood to have an ortholog than the entire set of human proteins from SwissProt (blue).
Figure 5
PHOSIDA: evolutionary section. The phylogeny in 70 species is illustrated for each phosphoprotein. The degree of homology is indicated by colors. Red means that the selected phosphoprotein does not show any significant sequence similarity. Blue means that the sequence of the phosphoprotein is significantly similar to a protein of another organism, but only one-directionally according to BLASTP. Green means that the phosphoprotein is probably orthologous to a protein of the chosen organism, since its sequence is significantly similar to the homologous protein in both directions. To enable users to set more stringent criteria for homology relating to the identities of aligned sequences and to check the entire sequence similarity, the global alignments of homologous proteins are also provided.
Figure 6
PHOSIDA: evolutionary section. The conservation status of phosphorylation sites within global alignments of homologous proteins is indicated in green or red. Green means that the chosen phosphorylation is conserved. Furthermore, the surrounding aligned sequence is also displayed, to check the conservation of matching kinase motifs.
Figure 7
Percentage sequence identity of phosphoproteins with orthologs.
Figure 8
Conservation of phosphoserines (red) compared to non-phosphoserines (blue) in phosphoproteins. Phosphoserines are significantly more conserved except in yeast.
Figure 9
Conservation of phosphothreonines (red) compared to non-phosphothreonines (blue). Phosphothreonines are significantly more conserved within mammals.
Figure 10
Conservation of phosphotyrosines (red) compared to non-phosphotyrosines (blue). Tyrosine is very highly conserved in mammals in both forms. In more distantly related species the numbers are small and differences are not statistically significant.
Figure 11
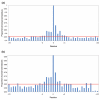
Conservation of phosphorylation motifs. Bars represent the proportion of identical residues in zebrafish orthologs of human phosphoproteins. The red line is the average identity in the region -20 to +20 amino acids surrounding the phosphosite. For both (a) serine and (b) threonine, about five amino acids in each direction show elevated sequence identity.
Figure 12
Feature transformation of phosphorylation sites for in silico prediction. The surrounding sequence of a phosphorylation site comprises 260 dimensions. Each dimension is defined by the position within the surrounding region and the amino acid type. The possible values in each dimension are 0 and 1. (a) Primary sequence (b) Extends set a by three dimensions, which include information about the predicted secondary structure of the phosphorylation site. (c) Extends set b by one dimension that contains the predicted accessibility. (d) Extends set a by three dimensions that reflect the conservation of the phosphosite in mammals and seven additional dimensions that describe the protein conservation in yeast, fly, zebrafish, chicken, cow, rat and mouse. (e) Combines set c and set d.
Figure 13
Precision-recall curve for phosphoserines. The two lines present the tradeoff between false positives and false negatives without (blue) and with (green) inclusion of structural and evolutionary constraints.
Similar articles
- PHOSIDA 2011: the posttranslational modification database.
Gnad F, Gunawardena J, Mann M. Gnad F, et al. Nucleic Acids Res. 2011 Jan;39(Database issue):D253-60. doi: 10.1093/nar/gkq1159. Epub 2010 Nov 16. Nucleic Acids Res. 2011. PMID: 21081558 Free PMC article. - From Phosphosites to Kinases.
Munk S, Refsgaard JC, Olsen JV, Jensen LJ. Munk S, et al. Methods Mol Biol. 2016;1355:307-21. doi: 10.1007/978-1-4939-3049-4_21. Methods Mol Biol. 2016. PMID: 26584935 Review. - NetworKIN: a resource for exploring cellular phosphorylation networks.
Linding R, Jensen LJ, Pasculescu A, Olhovsky M, Colwill K, Bork P, Yaffe MB, Pawson T. Linding R, et al. Nucleic Acids Res. 2008 Jan;36(Database issue):D695-9. doi: 10.1093/nar/gkm902. Epub 2007 Nov 2. Nucleic Acids Res. 2008. PMID: 17981841 Free PMC article. - In silico analysis of phosphoproteome data suggests a rich-get-richer process of phosphosite accumulation over evolution.
Yachie N, Saito R, Sugahara J, Tomita M, Ishihama Y. Yachie N, et al. Mol Cell Proteomics. 2009 May;8(5):1061-71. doi: 10.1074/mcp.M800466-MCP200. Epub 2009 Jan 9. Mol Cell Proteomics. 2009. PMID: 19136663 Free PMC article. - Databases and Computational Tools for Evolutionary Analysis of Protein Phosphorylation.
Tan CSH. Tan CSH. Methods Mol Biol. 2017;1636:475-484. doi: 10.1007/978-1-4939-7154-1_29. Methods Mol Biol. 2017. PMID: 28730497 Review.
Cited by
- Profile-based short linear protein motif discovery.
Haslam NJ, Shields DC. Haslam NJ, et al. BMC Bioinformatics. 2012 May 18;13:104. doi: 10.1186/1471-2105-13-104. BMC Bioinformatics. 2012. PMID: 22607209 Free PMC article. - HIM-17 regulates the position of recombination events and GSP-1/2 localization to establish short arm identity on bivalents in meiosis.
Nadarajan S, Altendorfer E, Saito TT, Martinez-Garcia M, Colaiácovo MP. Nadarajan S, et al. Proc Natl Acad Sci U S A. 2021 Apr 27;118(17):e2016363118. doi: 10.1073/pnas.2016363118. Proc Natl Acad Sci U S A. 2021. PMID: 33883277 Free PMC article. - A mass spectrometric-derived cell surface protein atlas.
Bausch-Fluck D, Hofmann A, Bock T, Frei AP, Cerciello F, Jacobs A, Moest H, Omasits U, Gundry RL, Yoon C, Schiess R, Schmidt A, Mirkowska P, Härtlová A, Van Eyk JE, Bourquin JP, Aebersold R, Boheler KR, Zandstra P, Wollscheid B. Bausch-Fluck D, et al. PLoS One. 2015 Apr 20;10(3):e0121314. doi: 10.1371/journal.pone.0121314. eCollection 2015. PLoS One. 2015. PMID: 25894527 Free PMC article. - Sites of regulated phosphorylation that control K-Cl cotransporter activity.
Rinehart J, Maksimova YD, Tanis JE, Stone KL, Hodson CA, Zhang J, Risinger M, Pan W, Wu D, Colangelo CM, Forbush B, Joiner CH, Gulcicek EE, Gallagher PG, Lifton RP. Rinehart J, et al. Cell. 2009 Aug 7;138(3):525-36. doi: 10.1016/j.cell.2009.05.031. Cell. 2009. PMID: 19665974 Free PMC article. - Posttranslational regulation impacts the fate of duplicated genes.
Amoutzias GD, He Y, Gordon J, Mossialos D, Oliver SG, Van de Peer Y. Amoutzias GD, et al. Proc Natl Acad Sci U S A. 2010 Feb 16;107(7):2967-71. doi: 10.1073/pnas.0911603107. Epub 2009 Dec 22. Proc Natl Acad Sci U S A. 2010. PMID: 20080574 Free PMC article.
References
- Pawson T, Nash P. Protein-protein interactions define specificity in signal transduction. Genes Dev. 2000;14:1027–1047. - PubMed
MeSH terms
Substances
LinkOut - more resources
Full Text Sources
Other Literature Sources


