Immunosurveillance by hematopoietic progenitor cells trafficking through blood, lymph, and peripheral tissues - PubMed (original) (raw)
Immunosurveillance by hematopoietic progenitor cells trafficking through blood, lymph, and peripheral tissues
Steffen Massberg et al. Cell. 2007.
Abstract
Constitutive egress of bone marrow (BM)-resident hematopoietic stem and progenitor cells (HSPCs) into the blood is a well-established phenomenon, but the ultimate fate and functional relevance of circulating HSPCs is largely unknown. We show that mouse thoracic duct (TD) lymph contains HSPCs that possess short- and long-term multilineage reconstitution capacity. TD-derived HSPCs originate in the BM, enter the blood, and traffic to multiple peripheral organs, where they reside for at least 36 hr before entering draining lymphatics to return to the blood and, eventually, the BM. HSPC egress from extramedullary tissues into lymph depends on sphingosine-1-phosphate receptors. Migratory HSPCs proliferate within extramedullary tissues and give rise to tissue-resident myeloid cells, preferentially dendritic cells. HSPC differentiation is amplified upon exposure to Toll-like receptor agonists. Thus, HSPCs can survey peripheral organs and can foster the local production of tissue-resident innate immune cells under both steady-state conditions and in response to inflammatory signals.
Figures
Figure 1. Clonogenic HSPCs travel in TD lymph
A, FACS analysis of TD MNCs. Numbers show the frequency of gated cells among total MNCs. No events where detected in the LSK gate with isotype-matched control antibodies (data not shown). B, Concentration of CFU-Cs in normal mouse PB and TD lymph. Columns and error bars represent mean±sem, n=12-23 assays (from 6-12 animals), circles represent results from individual assays. C, Absolute (left) and relative frequencies (right) of CFU-Cs in total MNCs or sorted Lin+, Lin−c-Kit−, and Lin−c-Kit+ TD cells. Mean±sem are presented, n=4-16 assays. Right panel: Representative micrographs of Lin-c-Kit+ TD-derived CFU-Cs, defined by the presence of granulocytes, macrophages, erythroid cells and megakaryocytes as CFU-granulocyte (CFU-G), CFU-macrophage (CFU-M), CFU-granulocyte, macrophage (CFU-GM), CFU-granulocyte, erythroid, macrophage, megakaryocyte (CFU-GEMM), respectively. Bars represent 50μm.
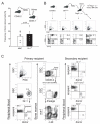
Figure 2. TD lymph HSPCs possess long-term multilineage repopulation capacity
A, TD-derived CD45.2+ MNCs (2 × 10⁷) were injected into sublethally irradiated CD45.1+ recipients. Chimerism among total MNC and Gr-1+ cells in PB was determined by FACS 6wks after transplantation, n=6. B, TCR-β+ T cells are found in PB of WT mice (first column), but not in nude (second column) or Rag2−/−γc−/− mice (third column). Transfer of TD-MNCs (2×10⁷) from nude mice into lethally irradiated Rag2−/−γc−/− mice restored T cells in Rag2−/−γc−/− recipients (fourth column). Numbers show the frequency of CD8α+ TCR-β+ and CD8α− (mostly CD4+) TCR-β+ cells among MNCs. Data are representative of 2 experiments. C, CD45.2+ TD-MNCs (2×10⁷) were transplanted into sublethally irradiated CD45.1+ primary recipients. Twelve weeks later, chimerism among PB granulocytes (Gr-1+) was determined (left column). Analysis of CD45.2+ cells in BM (middle column) demonstrates the persistence of a Lin− subset, which includes LSK cells (indicated by circle in bottom panel). Right column: Twelve weeks after primary transplantation, the CD45.2+ CD45.1− cells were sorted out of the primary recipient's BM and transplanted into a lethally irradiated CD45.1+ secondary host. Chimerism among PB granulocytes (Gr-1+), T cells (CD8+TCR-β+), and B cells (B220+) was assessed by FACS 12 weeks after secondary transplantation. Numbers show the frequency of cells in the individual quadrants.
Figure 3. Secondary lymphoid organs are not required for recirculation of HSPCs across extramedullary, non-lymphoid tissues
CFU-C assays were performed using TD-MNC collected from WT or LT-α−/− mice. A, concentration of MNC in lymph, n=6-12 animals; B, relative (left) and absolute frequencies (right) of CFU-Cs among lymph-borne MNCs, n=14-28 assays. Bars show mean±SEM.
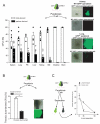
Figure 4. Recirculation of HSPCs through multiple extramedullary, non-lymphoid tissues
A, WT and β-actin/GFP transgenic mice were parabiosed and analyzed by isolating MNCs from indicated tissues and testing for GFP+ and GFP− CFU-C content (bar graph). Micrographs show representative brightfield (left) and fluorescence (right) images of host- and partner-derived CFU-Cs. *P<0.05, n=2-8. B, CFU-C chimerism in TD lymph of parabiotic mice, n=4. C, CFU-C chimerism in PB (closed circles) and TD lymph (open circles) at different time points after surgical separation of parabiotic mice, n=4-8 experiments.
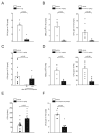
Figure 5. Egress of HSPCs from extramedullary tissues into lymph is PTX-sensitive and depends on S1P. A, Effect of PTX on lymph-borne CFUc
Lymph was collected for 8h from mice that were previously treated for 2h with vehicle or 1μg PTX, and CFU-C concentration was measured. Bars show mean±SEM, n=4-6 assays. B, Effect of FTY720 on lymph-borne MNCs and CFUc. Effect of treatment with S1P receptor antagonist FTY720 (6 hr) on MNC concentration (left panel, n=4-7) and CFU-C content (right panel, n=12-14) in lymph. C, Effect of FTY720 in LTx-α−/− mice. CFU-C assays were performed using thoracic duct MNC collected from LT-α deficient mice, treated with vehicle or FTY720. Lymph MNCs were collected for 8h from FTY720-pretreated mice starting at 6 or 48h after the last drug administration. The number of CFU-Cs per ml of lymph is shown. Error bars show s.e.m. D, Effect of FTY720 on blood-borne MNCs and CFUc. Effect of treatment with FTY720 (6hr) on MNC concentration (left panel) and CFU-C frequency (right panel) in PB. E, Effect of FTY720 on hepatic CFUc. Liver MNCs were collected from mice treated with vehicle or FTY720 (3mg/kg) for 7 days. Total number of CFU-C per liver are given. F, Effect of THI on lymph-borne CFUc. CFU-C content in TD lymph of control mice (vehicle) and animals that had received the S1P lyase inhibitor THI for three days (n=7-8).
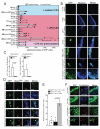
Figure 6. HSPCs proliferate and give rise to myeloid cells in peripheral tissues particularly in response to TLR ligands
A-B, Distinct TD- or BM-derived HSPC-enriched populations were implanted under the left kidney capsule of WT mice with medium or LPS with or without preincubation for 12h as indicated. Medium or LPS without cells was injected under the contralateral control kidney capsule. A, Quantitative analysis of the total number of GFP+ cells (G) and of GFP+ myeloid cells (M) in the left (empty bars and filled circles) and in the right (control, open circles) kidney. *P<0.05 vs. control kidney, #P<0.05 vs. medium, n=3 experiments, mean±SEM. B, Representative confocal images showing expression of GFP and reactivity with a mixture of mAbs to myeloid markers (CD11c, CD11b, F4/80, Gr-1) 6 days after implantation. Bars represent 50μm. C, Detection of GFP+ (donor-derived) CFU-C within the BM (left) and PB (right) after implantation of Lin-c-Kit+Sca-1+ cells preincubated with medium or LPS for 12h. Mean±SEM, n=3 experiments. D-E, 104 HSPC-enriched Lin−c-Kit+ GFP+ cells were implanted into the left kidney capsule of WT recipient mice together with LPS. D, Representative micrographs showing the expression of GFP, Gr-1, CD11c, or the PDC marker 120G8 in the kidney 6 days later. Bars represent 50μm. E, Relative subset frequencies among GFP+ cells in serial kidney sections, n=3 experiments, mean±SEM. F, Representative confocal images showing expression of GFP, incorporation of BrDU and expression of Ki-67 6 days after implantation of the indicated HSPC populations. Bars represent 10μm. Arrows indicate GFP+ BrDU+ cells, arrow heads show GFP− BrDU+ cells.
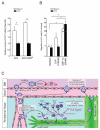
Figure 7. A TLR ligand reduces the capacity of HSPCs to migrate to sphingosine 1-phosphate
A, Quantitative PCR analysis of S1P1 mRNA expression by medium- or LPS-treated Lin− or Lin−c-Kit+ TD-derived cells. The amount of S1P1 mRNA is expressed as relative amount of LPS-treated cells normalized to GAPDH. Experiments were performed in quadruplicate, *P<0.05. B, Lin− BM-derived cells pretreated for 12h with LPS or medium were tested for their ability to migrate to 100nM S1P or to 50nM CXCL12/SDF-1α. Migration to the lower chamber was determined by flow cytometry and is given as percentage of the number of input cells; n=3 experiments per group, *P<0.05 vs. SDF-1α. C, Schematic model illustrating the trafficking of migratory HSPCs under physiological conditions and during ainflammation (for details see text).
Comment in
- Stem cells on patrol.
Welner RS, Kincade PW. Welner RS, et al. Cell. 2007 Nov 30;131(5):842-4. doi: 10.1016/j.cell.2007.11.010. Cell. 2007. PMID: 18045530 Free PMC article.
Similar articles
- Novel trafficking routes for hematopoietic stem and progenitor cells.
Massberg S, von Andrian UH. Massberg S, et al. Ann N Y Acad Sci. 2009 Sep;1176:87-93. doi: 10.1111/j.1749-6632.2009.04609.x. Ann N Y Acad Sci. 2009. PMID: 19796236 Free PMC article. - Different Human Immune Lineage Compositions Are Generated in Non-Conditioned NBSGW Mice Depending on HSPC Source.
Hess NJ, Lindner PN, Vazquez J, Grindel S, Hudson AW, Stanic AK, Ikeda A, Hematti P, Gumperz JE. Hess NJ, et al. Front Immunol. 2020 Oct 19;11:573406. doi: 10.3389/fimmu.2020.573406. eCollection 2020. Front Immunol. 2020. PMID: 33193358 Free PMC article. - Sphingosine-1-Phosphate Receptor-3 Supports Hematopoietic Stem and Progenitor Cell Residence Within the Bone Marrow Niche.
Ogle ME, Olingy CE, Awojoodu AO, Das A, Ortiz RA, Cheung HY, Botchwey EA. Ogle ME, et al. Stem Cells. 2017 Apr;35(4):1040-1052. doi: 10.1002/stem.2556. Epub 2017 Jan 19. Stem Cells. 2017. PMID: 28026131 Free PMC article. - Hematopoietic stem and progenitor cells: their mobilization and homing to bone marrow and peripheral tissue.
Schulz C, von Andrian UH, Massberg S. Schulz C, et al. Immunol Res. 2009;44(1-3):160-8. doi: 10.1007/s12026-009-8109-6. Immunol Res. 2009. PMID: 19340403 Review. - Trafficking of murine hematopoietic stem and progenitor cells in health and vascular disease.
Schulz C, Von Andrian UH, Massberg S. Schulz C, et al. Microcirculation. 2009 Aug;16(6):497-507. doi: 10.1080/10739680902948351. Epub 2009 May 26. Microcirculation. 2009. PMID: 19479622 Review.
Cited by
- Myeloid skewing in murine autoimmune arthritis occurs in hematopoietic stem and primitive progenitor cells.
Oduro KA Jr, Liu F, Tan Q, Kim CK, Lubman O, Fremont D, Mills JC, Choi K. Oduro KA Jr, et al. Blood. 2012 Sep 13;120(11):2203-13. doi: 10.1182/blood-2011-11-391342. Epub 2012 Jul 31. Blood. 2012. PMID: 22855602 Free PMC article. - Macrophages Orchestrate Hematopoietic Programs and Regulate HSC Function During Inflammatory Stress.
Seyfried AN, Maloney JM, MacNamara KC. Seyfried AN, et al. Front Immunol. 2020 Jul 23;11:1499. doi: 10.3389/fimmu.2020.01499. eCollection 2020. Front Immunol. 2020. PMID: 32849512 Free PMC article. Review. - Sphingosine-1-phosphate and other lipid mediators generated by mast cells as critical players in allergy and mast cell function.
Kulinski JM, Muñoz-Cano R, Olivera A. Kulinski JM, et al. Eur J Pharmacol. 2016 May 5;778:56-67. doi: 10.1016/j.ejphar.2015.02.058. Epub 2015 May 2. Eur J Pharmacol. 2016. PMID: 25941085 Free PMC article. Review. - Staphylococcus aureus recognition by hematopoietic stem and progenitor cells via TLR2/MyD88/PGE2 stimulates granulopoiesis in wounds.
Granick JL, Falahee PC, Dahmubed D, Borjesson DL, Miller LS, Simon SI. Granick JL, et al. Blood. 2013 Sep 5;122(10):1770-8. doi: 10.1182/blood-2012-11-466268. Epub 2013 Jul 18. Blood. 2013. PMID: 23869087 Free PMC article. - Vasculopathy-associated hyperangiotensinemia mobilizes haematopoietic stem cells/progenitors through endothelial AT₂R and cytoskeletal dysregulation.
Chang KH, Nayak RC, Roy S, Perumbeti A, Wellendorf AM, Bezold KY, Pirman M, Hill SE, Starnes J, Loberg A, Zhou X, Inagami T, Zheng Y, Malik P, Cancelas JA. Chang KH, et al. Nat Commun. 2015 Jan 9;6:5914. doi: 10.1038/ncomms6914. Nat Commun. 2015. PMID: 25574809 Free PMC article.
References
- Adams GB, Scadden DT. The hematopoietic stem cell in its place. Nat Immunol. 2006;7:333–337. - PubMed
- Akashi K, Traver D, Miyamoto T, Weissman IL. A clonogenic common myeloid progenitor that gives rise to all myeloid lineages. Nature. 2000;404:193–197. - PubMed
- Cardier JE, Barbera-Guillem E. Extramedullary hematopoiesis in the adult mouse liver is associated with specific hepatic sinusoidal endothelial cells. Hepatology. 1997;26:165–175. - PubMed
- Chiba K, Yanagawa Y, Masubuchi Y, Kataoka H, Kawaguchi T, Ohtsuki M, Hoshino Y. FTY720, a novel immunosuppressant, induces sequestration of circulating mature lymphocytes by acceleration of lymphocyte homing in rats. I. FTY720 selectively decreases the number of circulating mature lymphocytes by acceleration of lymphocyte homing. J Immunol. 1998;160:5037–5044. - PubMed
Publication types
MeSH terms
Substances
Grants and funding
- AR42689/AR/NIAMS NIH HHS/United States
- R01 AI061663-05/AI/NIAID NIH HHS/United States
- HL56949/HL/NHLBI NIH HHS/United States
- S10 RR021190/RR/NCRR NIH HHS/United States
- P01 HL056949-10/HL/NHLBI NIH HHS/United States
- P01 HL056949-08/HL/NHLBI NIH HHS/United States
- P30 AR042689/AR/NIAMS NIH HHS/United States
- P01 HL056949-119001/HL/NHLBI NIH HHS/United States
- P01 HL056949-089001/HL/NHLBI NIH HHS/United States
- R01 AI072252-01/AI/NIAID NIH HHS/United States
- P01 HL056949/HL/NHLBI NIH HHS/United States
- R01 AI069259-03/AI/NIAID NIH HHS/United States
- P01 HL056949-09/HL/NHLBI NIH HHS/United States
- P01 HL056949-129001/HL/NHLBI NIH HHS/United States
- R01 AI061663/AI/NIAID NIH HHS/United States
- AI061663/AI/NIAID NIH HHS/United States
- P01 HL056949-11/HL/NHLBI NIH HHS/United States
- S10 RR021190-010001/RR/NCRR NIH HHS/United States
- P01 HL056949-109001/HL/NHLBI NIH HHS/United States
- R01 AI072252/AI/NIAID NIH HHS/United States
- R01 AI069259/AI/NIAID NIH HHS/United States
- P01 HL056949-099001/HL/NHLBI NIH HHS/United States
- P01 HL056949-12/HL/NHLBI NIH HHS/United States
LinkOut - more resources
Full Text Sources
Other Literature Sources
Medical

