Trends in recent temperature and radial tree growth spanning 2000 years across northwest Eurasia - PubMed (original) (raw)
Comparative Study
Trends in recent temperature and radial tree growth spanning 2000 years across northwest Eurasia
Keith R Briffa et al. Philos Trans R Soc Lond B Biol Sci. 2008.
Abstract
This paper describes variability in trends of annual tree growth at several locations in the high latitudes of Eurasia, providing a wide regional comparison over a 2000-year period. The study focuses on the nature of local and widespread tree-growth responses to recent warming seen in instrumental observations, available in northern regions for periods ranging from decades to a century. Instrumental temperature data demonstrate differences in seasonal scale of Eurasian warming and the complexity and spatial diversity of tree-growing-season trends in recent decades. A set of long tree-ring chronologies provides empirical evidence of association between inter-annual tree growth and local, primarily summer, temperature variability at each location. These data show no evidence of a recent breakdown in this association as has been found at other high-latitude Northern Hemisphere locations. Using Kendall's concordance, we quantify the time-dependent relationship between growth trends of the long chronologies as a group. This provides strong evidence that the extent of recent widespread warming across northwest Eurasia, with respect to 100- to 200-year trends, is unprecedented in the last 2000 years. An equivalent analysis of simulated temperatures using the HadCM3 model fails to show a similar increase in concordance expected as a consequence of anthropogenic forcing.
Figures
Figure 1
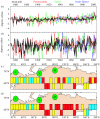
High-latitude Eurasian instrumental seasonal temperature series for: (a) summer, the mean of June to August and (b) winter, the mean of December to February. The thick black line indicates the average of monthly land air temperature data for the thirty-five 5°×5° grid boxes (Brohan et al. 2006) listed in appendix A. The data are anomalies from the 1961 to 1990 period mean. Individual grid box data representing Fennoscandia (62.5° N, 22.5° E), Yamal (62.5° N, 67.5° E) and Avam–Taimyr (62.5° N, 102.5° E) are also shown. Temperature trends for (c) summer and (d) winter for the period 1950–1994 (calculated from standardized instrumental anomaly data) for individual 5°×5° average grid box series listed in appendix A. The sign and magnitude of the trends are indicated by colour coding. The only significant trends (_p_>0.05) are positive (i.e. greater than 0.015 as per the scale of figure 2). The green circles show the approximate source regions of tree-ring chronology data (table 1) described in this paper: F, Fennoscandia; Y, Yamal; AT, Avam–Taimyr.
Figure 2
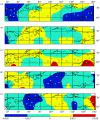
The spatial distribution of trends in a number of growing-season-related temperature parameters: (a) the start of the growing season; (b) the end of the growing season; (c) the growing degree day sum greater than 5°C within the growing season; (d) the number of frost days in the growing season and (e) the timing of maximum temperature. All data refer to the period 1950–1994 and are based on the 34 meteorological station records (shown as white dots: see appendix A for details) distributed across northern Eurasia. The trend data are normalized and colour coded so that dark blue and red indicate trends that are significant at the 95% level.
Figure 3
Regional curve standardized (RCS) chronologies (thin lines) and smoothed chronologies, the sum of the first three components of singular spectrum analysis of each RCS chronology (thick lines), for the regions: (a) Fennoscandia, (b) Yamal and (c) Avam–Taimyr. The grey shading represents the changing number of samples that go to make up the chronology through time.
Figure 4
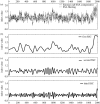
(a) The RCS northwest Eurasian chronology (thin lines) and the same chronology smoothed (thick lines), by adding the total variance explained by the (b) first, (c) second and (d) third singular spectrum component time series.
Figure 5
Distributions of the standardized 101-year moving (a) trend parameters and (b) means, calculated from the SSA-filtered Northwest Eurasian chronology. Note that the results are not substantially different if based on unfiltered data and are shown for separate analysis periods with windows centred on years between AD 51–1849 (grey bars) and 1900–1946 (black bars).
Figure 6
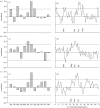
Correlation plots (1950–1994) between regional RSC chronologies and (i) local monthly mean temperatures and (ii) pentad data of (a) Fennoscandia, (b) Yamal and (c) Avam–Taimyr. The dashed horizontal lines indicate thresholds for correlations significant at the 95% level. See the legend of figure 8 and appendix A for details of the temperature data.
Figure 7
Variability of local cumulative pentad temperature data (black solid line), monthly mean grid box temperature data (black dashed line) and RCS tree-ring indices (thick grey line) for different regions: (a) Fennoscandia (temperature data are either the sum of Abisko consecutive pentads from number 38 to 46 or monthly means of July and August); (b) Yamal (Hoseda-Hard pentads from 27 to 37 and monthly mean for June and July) and (c) Avam–Taimyr (Hatanga pentads from 34 to 38 and monthly mean for July). All data were standardized by subtraction of the mean and division by the standard deviation over the period common to both temperature and tree-ring indices. Simple correlations between chronology and monthly mean temperatures (_r_cm) and between chronology and cumulative pentad temperatures (_r_cp), along with their significance levels are shown in the lower right of each box. Correlations between the monthly mean and cumulative pentad data (_r_pm) are given in the lower left. All correlations are significant at the 95% level.
Figure 8
(a) Kendall's concordance coefficients calculated for overlapping 101-year windows using the RCS chronologies of Fennoscandia, Yamal and Avam–Taimyr, as SSA-filtered data (red line) and unfiltered data (blue line); (b) concordance coefficients for the unfiltered RCS chronologies calculated for moving windows of 51, 101 and 201 years, and the same data smoothed using the negative-exponential weighted least-squares method; (c) concordance coefficients for windows of 51 and 101 years comparing the mean of June and July mean monthly temperatures for three regions (equivalent to the sources of the three chronologies) as simulated by HadCM3 for 500 years under ‘natural’ forcings and (d) the equivalent concordance values using the same regional temperatures extracted from a 250-year experiment under combined natural and anthropogenic forcing (the ‘all forcings’ experiment). Significance levels (_p_=0.05) shown as dashed lines on (b–d).
Figure 9
Distribution of (standardized) concordance coefficients (mean=0.40, s.d.=0.08) between the RCS chronologies of Fennoscandia, Yamal and Avam–Taimyr (derived for 101-year moving windows) and separated into three time periods with windows centred on AD 51–1899 (light grey bars) excluding 764–960 (dark grey bars) shown separately and 1900–1946 (black bars).
Similar articles
- Low-frequency signals in long tree-ring chronologies for reconstructing past temperature variability.
Esper J, Cook ER, Schweingruber FH. Esper J, et al. Science. 2002 Mar 22;295(5563):2250-3. doi: 10.1126/science.1066208. Science. 2002. PMID: 11910106 - Temperature-induced water stress in high-latitude forests in response to natural and anthropogenic warming.
Trahan MW, Schubert BA. Trahan MW, et al. Glob Chang Biol. 2016 Feb;22(2):782-91. doi: 10.1111/gcb.13121. Epub 2016 Jan 6. Glob Chang Biol. 2016. PMID: 26451763 - Simulated versus observed patterns of warming over the extratropical Northern Hemisphere continents during the cold season.
Wallace JM, Fu Q, Smoliak BV, Lin P, Johanson CM. Wallace JM, et al. Proc Natl Acad Sci U S A. 2012 Sep 4;109(36):14337-42. doi: 10.1073/pnas.1204875109. Epub 2012 Jul 30. Proc Natl Acad Sci U S A. 2012. PMID: 22847408 Free PMC article. - Long-term growth-increment chronologies reveal diverse influences of climate forcing on freshwater and forest biota in the Pacific Northwest.
Black BA, Dunham JB, Blundon BW, Brim-Box J, Tepley AJ. Black BA, et al. Glob Chang Biol. 2015 Feb;21(2):594-604. doi: 10.1111/gcb.12756. Epub 2014 Nov 17. Glob Chang Biol. 2015. PMID: 25258169 - Differential responses to changes in growth temperature between trees from different functional groups and biomes: a review and synthesis of data.
Way DA, Oren R. Way DA, et al. Tree Physiol. 2010 Jun;30(6):669-88. doi: 10.1093/treephys/tpq015. Epub 2010 Apr 5. Tree Physiol. 2010. PMID: 20368338 Review.
Cited by
- Plant-Soil-Climate Interaction in Observed and Simulated Tree-Radial Growth Dynamics of Downy Birch in Permafrost.
Fonti MV, Tychkov II, Shishov VV, Shashkin AV, Prokushkin AS. Fonti MV, et al. Front Plant Sci. 2022 May 31;13:780153. doi: 10.3389/fpls.2022.780153. eCollection 2022. Front Plant Sci. 2022. PMID: 35712567 Free PMC article. - A 3,500-year tree-ring record of annual precipitation on the northeastern Tibetan Plateau.
Yang B, Qin C, Wang J, He M, Melvin TM, Osborn TJ, Briffa KR. Yang B, et al. Proc Natl Acad Sci U S A. 2014 Feb 25;111(8):2903-8. doi: 10.1073/pnas.1319238111. Epub 2014 Feb 10. Proc Natl Acad Sci U S A. 2014. PMID: 24516152 Free PMC article. - Accelerating upward treeline shift in the Altai Mountains under last-century climate change.
Cazzolla Gatti R, Callaghan T, Velichevskaya A, Dudko A, Fabbio L, Battipaglia G, Liang J. Cazzolla Gatti R, et al. Sci Rep. 2019 May 22;9(1):7678. doi: 10.1038/s41598-019-44188-1. Sci Rep. 2019. PMID: 31118471 Free PMC article. - An extended Arctic proxy temperature database for the past 2,000 years.
McKay NP, Kaufman DS. McKay NP, et al. Sci Data. 2014 Aug 19;1:140026. doi: 10.1038/sdata.2014.26. eCollection 2014. Sci Data. 2014. PMID: 25977783 Free PMC article. - Responses of tree-ring growth and crop yield to drought indices in the Shanxi province, North China.
Sun J, Liu Y. Sun J, et al. Int J Biometeorol. 2014 Sep;58(7):1521-30. doi: 10.1007/s00484-013-0757-5. Epub 2013 Oct 26. Int J Biometeorol. 2014. PMID: 24162181
References
- Briffa K.R. Annual climate variability in the Holocene: interpreting the message of ancient trees. Quatern. Sci. Rev. 2000;19:87–105. doi: 10.1016/S0277-3791(99)00056-6. - DOI
- Briffa K.R, Jones P.D. Basic chronology statistics and assessment. In: Cook E.R, Kairiukstis L.A, editors. Methods of dendrochronology. Kluwer Academic Publishers; Dordrecht, The Netherlands: 1990. pp. 137–152.
- Briffa K.R, Bartholin T.S, Eckstein D, Jones P.D, Karlen W, Schweingruber F.H, Zetterberg P. A 1,400-year tree-ring record of summer temperatures in Fennoscandia. Nature. 1990;346:434–439. doi: 10.1038/346434a0. - DOI
- Briffa K.R, Jones P.D, Bartholin T.S, Eckstein D, Schweingruber F.H, Karlen W, Zetterberg P, Eronen M. Fennoscandian summers from AD-500—temperature-changes on short and long timescales. Clim. Dynam. 1992;7:111–119.
- Briffa K.R, Jones P.D, Schweingruber F.H, Osborn T.J. Influence of volcanic eruptions on Northern Hemisphere summer temperature over the past 600 years. Nature. 1998a;393:450–455. doi: 10.1038/30943. - DOI
Publication types
MeSH terms
LinkOut - more resources
Full Text Sources


