Regulation of adult erythropoiesis by prolyl hydroxylase domain proteins - PubMed (original) (raw)
Regulation of adult erythropoiesis by prolyl hydroxylase domain proteins
Kotaro Takeda et al. Blood. 2008.
Abstract
Polycythemia is often associated with erythropoietin (EPO) overexpression and defective oxygen sensing. In normal cells, intracellular oxygen concentrations are directly sensed by prolyl hydroxylase domain (PHD)-containing proteins, which tag hypoxia-inducible factor (HIF) alpha subunits for polyubiquitination and proteasomal degradation by oxygen-dependent prolyl hydroxylation. Here we show that different PHD isoforms differentially regulate HIF-alpha stability in the adult liver and kidney and suppress Epo expression and erythropoiesis through distinct mechanisms. Although Phd1(-/-) or Phd3(-/-) mice had no apparent defects, double knockout of Phd1 and Phd3 led to moderate erythrocytosis. HIF-2alpha, which is known to activate Epo expression, accumulated in the liver. In adult mice deficient for PHD2, the prototypic Epo transcriptional activator HIF-1alpha accumulated in both the kidney and liver. Elevated HIF-1alpha levels were associated with dramatically increased concentrations of both Epo mRNA in the kidney and Epo protein in the serum, which led to severe erythrocytosis. In contrast, heterozygous mutation of Phd2 had no detectable effects on blood homeostasis. These findings suggest that PHD1/3 double deficiency leads to erythrocytosis partly by activating the hepatic HIF-2alpha/Epo pathway, whereas PHD2 deficiency leads to erythrocytosis by activating the renal Epo pathway.
Figures
Figure 1
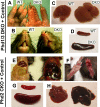
Erythemic appearances in Phd1/3 DKO and Phd2 CKO mice. (A-D) Erythemic external appearance (reddish paw and snout, A and B, respectively), and enlarged liver (C) and spleen (D) in Phd1/3 DKO mice. WT, wild-type; DKO, Phd1/3 double knockout mice. (E-H) Phd2 CKO mice and Phd2f/f control mice. Abdomens (E) and paws (F) at approximately 6 weeks after tamoxifen treatment of both CKO and Phd2f/f mice. Note the necrotic intestine and red paw in Phd2 CKO mice. Left, Phd2f/f; right, Phd2 CKO. (C) Spleens. Top, Phd2f/f; bottom, Phd2 CKO. (D) Livers. Left, Phd2f/f, right, Phd2 CKO. Images were taken with a CoolSNAP charge-coupled device digital camera (Photometrics-Roger Scientific, Tucson, AZ) attached to a Leica MZFLIII stereomicroscope (Leica Microsystems, Heerbrugg, Switzerland). A single objective lens (Leica Plan 1.0, 10× magnification, Leica Microsystems) was used to obtain the images. Openlab (Improvision, Lexington, MA) was used for initial image acquisition, and Photoshop 7.0 (Adobe Systems, San Jose, CA) was used for subsequent processing.
Figure 2
Hematologic parameters of peripheral blood from _Phd1_−/−, _Phd3_−/−, and Phd1/3 DKO mice. (A-E) Phd1/3 DKO and wild-type control mice. RBC indicates red blood cells; Hb, hemoglobin; Hct, hemtocrit; and WBC, white blood cells. n = 6. (E) ELISA for serum Epo levels. n = 4. **P < .01; *_P_ < .05. (F-J) Normal blood properties in _Phd1_−/− or _Phd3_−/− mice. (A-I) Hematologic parameters of peripheral blood indicated in figures from wild-type (WT), _Phd1_−/−, or _Phd3_−/− mice. _P_ > .05 for all pairs of comparisons. n = 6. (J) ELISA for serum Epo levels in WT, _Phd1_−/−, or _Phd3_−/− mice. n = 6. Error bars represent SEM.
Figure 3
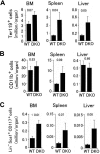
Flow cytometry analyses of hematopoietic progenitors in Phd1/3 DKO mice. (A) Erythroid (Ter119+); (B) myeloid (CD11b+); (C) HSC (Lin− Sca-1+ CD117+). Bone marrow (BM), spleen, and liver samples were analyzed. Total cell numbers in each organ are shown; n = 6 to 7. P values are indicated above the bars. Error bars represent SEM.
Figure 4
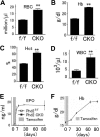
Abnormal hematologic parameters of peripheral blood from Phd2 CKO mice. (A-D), Phd2 CKO and Phd2f/f control mice were all treated with tamoxifen at 6 weeks of age and analyzed after another 6 weeks. Red blood cells, hemoglobin concentrations, hematocrit values, and white blood cells were all significantly increased. n = 6. **, P < 0.01. (E) Time course of serum Epo level increases as measured by ELISA. n = 3 at each time point. (F) Time course of increases in hemoglobin concentration. n = 3 at each time point. Error bars represent SEM.
Figure 5
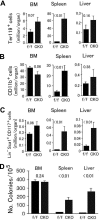
Analysis for hematopoietic progenitors and hematopoietic stem cells in Phd2 CKO mice. (A-C) Flow cytometry analyses. (A) Erythroid (Ter119+); (B) myeloid (CD11b+); (C) HSC (Lin− Sca-1+ CD117+). Bone marrow (BM), spleen, and liver samples were analyzed. Total cell numbers in each organ are shown. n = 6 to 7. P values are indicated above the bars. (D) Methylcellulose colony formation assay. Genotypes are indicated at the bottom. f/f and CKO refer to Phd2f/f and Phd2 CKO mice, respectively. Number of colonies per 105 cells are presented, n = 6; P values are indicated in the figure. Error bars represent SEM.
Figure 6
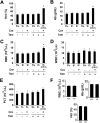
Normal hematologic parameters in mice heterozygous for Phd2 knockout. (A-E) Phd2 conditional knockout mice and controls. (A) Hematocrit values. (B) Hemoglobin concentrations. (C) Number of red blood cells. (D) White blood cells. (E) Platelets. Two weeks before tamoxifen administration, baseline measurements were performed (Tam, −). Measurements were taken again 2 weeks after tamoxifen administration (Tam, +). CreERT2 status is indicated as Cre − or +, representing absence or presence, respectively. Phd2f/− mice carrying CreERT2 and fed with tamoxifen are also designated as CKO, for conditional knockout. These are similar to Phd2 CKO mice used in other experiments except that one of the allele here was − before tamoxifen treatment; it was inherited as a germline mutation. For (A) to (E), n = 3 to 7; *P < .05. (F) Hematologic analysis of germline heterozygotes at more than 20 weeks of age. n = 5 to 6. Error bars represent SEM.
Figure 7
Molecular analysis for Phd2 CKO and Phd1/3 DKO mice. (A) Autoradiography of [35S]methionine-labeled PHD1, 2 and 3 produced by IVTT. Free, unincorporated [35S]methionine. (B) Western blotting analysis for PHD1, -2, and -3 in various tissues from wild-type adult mice. Equal amounts of IVTT-produced PHD1, -2, and -3 proteins were loaded as controls. Note PHD1 had 2 bands because of alternative translational initiation. (C) Anti-PHD2 Western blots for Phd1/3 DKO tissues. (D) Anti-HIF-1α and HIF-2α Western blots for Phd2 CKO and Phd1/3 DKO mice. (E,F) Q-PCR analysis for Epo mRNA. f/f, Phd2f/f; CKO, Phd2 CKO; WT, wild-type; DKO, Phd1/3 DKO. n = 6. (F) The scale in panel E was reduced. **P < .01; *P < .05. Error bars represent SEM.
Similar articles
- Distinct subpopulations of FOXD1 stroma-derived cells regulate renal erythropoietin.
Kobayashi H, Liu Q, Binns TC, Urrutia AA, Davidoff O, Kapitsinou PP, Pfaff AS, Olauson H, Wernerson A, Fogo AB, Fong GH, Gross KW, Haase VH. Kobayashi H, et al. J Clin Invest. 2016 May 2;126(5):1926-38. doi: 10.1172/JCI83551. Epub 2016 Apr 18. J Clin Invest. 2016. PMID: 27088801 Free PMC article. - Hypoxia-inducible factor-1 (HIF-1) promotes its degradation by induction of HIF-alpha-prolyl-4-hydroxylases.
Marxsen JH, Stengel P, Doege K, Heikkinen P, Jokilehto T, Wagner T, Jelkmann W, Jaakkola P, Metzen E. Marxsen JH, et al. Biochem J. 2004 Aug 1;381(Pt 3):761-7. doi: 10.1042/BJ20040620. Biochem J. 2004. PMID: 15104534 Free PMC article. - HIF-1α is a protective factor in conditional PHD2-deficient mice suffering from severe HIF-2α-induced excessive erythropoiesis.
Franke K, Kalucka J, Mamlouk S, Singh RP, Muschter A, Weidemann A, Iyengar V, Jahn S, Wieczorek K, Geiger K, Muders M, Sykes AM, Poitz DM, Ripich T, Otto T, Bergmann S, Breier G, Baretton G, Fong GH, Greaves DR, Bornstein S, Chavakis T, Fandrey J, Gassmann M, Wielockx B. Franke K, et al. Blood. 2013 Feb 21;121(8):1436-45. doi: 10.1182/blood-2012-08-449181. Epub 2012 Dec 20. Blood. 2013. PMID: 23264599 Free PMC article. - Involvement of oxygen-sensing pathways in physiologic and pathologic erythropoiesis.
Semenza GL. Semenza GL. Blood. 2009 Sep 3;114(10):2015-9. doi: 10.1182/blood-2009-05-189985. Epub 2009 Jun 3. Blood. 2009. PMID: 19494350 Review. - Update on mutations in the HIF: EPO pathway and their role in erythrocytosis.
Lappin TR, Lee FS. Lappin TR, et al. Blood Rev. 2019 Sep;37:100590. doi: 10.1016/j.blre.2019.100590. Epub 2019 Jul 16. Blood Rev. 2019. PMID: 31350093 Free PMC article. Review.
Cited by
- Molecular cloning of phd1 and comparative analysis of phd1, 2, and 3 expression in Xenopus laevis.
Han D, Wen L, Chen Y. Han D, et al. ScientificWorldJournal. 2012;2012:689287. doi: 10.1100/2012/689287. Epub 2012 May 3. ScientificWorldJournal. 2012. PMID: 22645445 Free PMC article. - Recent Advances and Therapeutic Implications of 2-Oxoglutarate-Dependent Dioxygenases in Ischemic Stroke.
Xie J, Zhang Z. Xie J, et al. Mol Neurobiol. 2024 Jul;61(7):3949-3975. doi: 10.1007/s12035-023-03790-1. Epub 2023 Dec 2. Mol Neurobiol. 2024. PMID: 38041714 Review. - Overexpression of HIF prolyl-hydoxylase-2 transgene in the renal medulla induced a salt sensitive hypertension.
Zhu Q, Liu M, Han WQ, Li PL, Wang Z, Li N. Zhu Q, et al. J Cell Mol Med. 2012 Nov;16(11):2701-7. doi: 10.1111/j.1582-4934.2012.01590.x. J Cell Mol Med. 2012. PMID: 22686466 Free PMC article. - Control of cyclin D1 and breast tumorigenesis by the EglN2 prolyl hydroxylase.
Zhang Q, Gu J, Li L, Liu J, Luo B, Cheung HW, Boehm JS, Ni M, Geisen C, Root DE, Polyak K, Brown M, Richardson AL, Hahn WC, Kaelin WG Jr, Bommi-Reddy A. Zhang Q, et al. Cancer Cell. 2009 Nov 6;16(5):413-24. doi: 10.1016/j.ccr.2009.09.029. Cancer Cell. 2009. PMID: 19878873 Free PMC article. - Cross-talk between hypoxia and insulin signaling through Phd3 regulates hepatic glucose and lipid metabolism and ameliorates diabetes.
Taniguchi CM, Finger EC, Krieg AJ, Wu C, Diep AN, LaGory EL, Wei K, McGinnis LM, Yuan J, Kuo CJ, Giaccia AJ. Taniguchi CM, et al. Nat Med. 2013 Oct;19(10):1325-30. doi: 10.1038/nm.3294. Epub 2013 Sep 15. Nat Med. 2013. PMID: 24037093 Free PMC article.
References
- Stroka DM, Burkhardt T, Desbaillets I, et al. HIF-1 is expressed in normoxic tissue and displays an organ-specific regulation under systemic hypoxia. FASEB J. 2001;15:2445–2453. - PubMed
- Chikuma M, Masuda S, Kobayashi T, Nagao M, Sasaki R. Tissue-specific regulation of erythropoietin production in the murine kidney, brain, and uterus. Am J Physiol Endocrinol Metab. 2000;279:E1242–E1248. - PubMed
- Cotes PM, Bangham DR. Bio-assay of erythropoietin in mice made polycythaemic by exposure to air at a reduced pressure. Nature. 1961;191:1065–1067. - PubMed
- Alafi MH, Cook SF. Role of the spleen in acclimatization to hypoxia. Am J Physiol. 1956;186:369–372. - PubMed
- Maran J, Prchal J. Polycythemia and oxygen sensing. Pathol Biol (Paris) 2004;52:280–284. - PubMed
Publication types
MeSH terms
Substances
LinkOut - more resources
Full Text Sources
Other Literature Sources
Medical
Molecular Biology Databases
Research Materials
