Light-evoked calcium responses of isolated melanopsin-expressing retinal ganglion cells - PubMed (original) (raw)
Comparative Study
Light-evoked calcium responses of isolated melanopsin-expressing retinal ganglion cells
Andrew T E Hartwick et al. J Neurosci. 2007.
Abstract
A small number (<2%) of mammalian retinal ganglion cells express the photopigment melanopsin and are intrinsically photosensitive (ipRGCs). Light depolarizes ipRGCs and increases intracellular calcium levels ([Ca2+]i) but the signaling cascades underlying these responses have yet to be elucidated. To facilitate physiological studies on these rare photoreceptors, highly enriched ipRGC cultures from neonatal rats were generated using anti-melanopsin-mediated plate adhesion (immunopanning). This novel approach enabled experiments on isolated ipRGCs, eliminating the potential confounding influence of rod/cone-driven input. Light induced a rise in [Ca2+]i (monitored using fura-2 imaging) in the immunopanned ipRGCs and the source of this Ca2+ signal was investigated. The Ca2+ responses were inhibited by 2-aminoethoxydiphenyl borate, SKF-96365 (1-2-(4-methoxyphenyl)-2-[3-(4-methoxyphenyl)propoxy]ethyl-1H-imidazole), flufenamic acid, lanthanum, and gadolinium, consistent with the involvement of canonical transient receptor potential (TRP) channels in ipRGC phototransduction. However, the contribution of direct Ca2+ flux through a putative TRP channel to ipRGC [Ca2+]i was relatively small, as most (approximately 90%) of the light-induced Ca2+ responses could be blocked by preventing action potential firing with tetrodotoxin. The L-type voltage-gated Ca2+ channel (VGCC) blockers verapamil and (+)-cis-diltiazem significantly reduced the light-evoked Ca2+ responses, while the internal Ca2+ stores depleting agent thapsigargin had negligible effect. These results indicate that Ca2+ influx through VGCCs, activated after action potential firing, was the primary source for light-evoked elevations in ipRGC [Ca2+]i. Furthermore, concurrent Ca2+ imaging and cell-attached electrophysiological recordings demonstrated that the Ca2+ responses were highly correlated to spike frequency, thereby establishing a direct link between action potential firing and somatic [Ca2+]i in light-stimulated ipRGCs.
Figures
Figure 1.
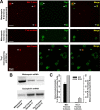
Enriched melanopsin-expressing RGC cultures. A, Top, Melanopsin-panned cells (denoted by arrows), paraformaldehyde-fixed on first day of culture, were labeled by antibodies targeting both the intracellular C terminus of melanopsin (red fluorescence) and the RGC cell-surface marker Thy1 (green fluorescence). Middle, To control for antibody specificity, melanopsin-panned cells from the same culture were processed identically except that primary melanopsin antibodies were omitted. Bottom, Thy1-panned cells obtained from the same rat litter (Thy1 panning followed melanopsin panning) and processed at the same time. Melanopsin-expressing RGCs were also present in Thy1-panned cultures (arrow) but were rare. B, RT-PCR confirmed the presence of melanopsin mRNA in both melanopsin- and Thy1-panned cultures, with increased message relative to internal control cyclophilin detected in melanopsin-panned cultures. C, Summary graph (means ± SEM) showing both the percentage of melanopsin-positive cells in melanopsin-panned and sibling Thy1-panned cultures from immunocytochemical cell counts (ICC; n = 5 cultures), and the melanopsin to cyclophilin product optical density ratios for Thy1-panned samples (n = 4) that were normalized within each PCR experiment (n = 3) to that for melanopsin-panned samples.
Figure 2.
Photosensitivity of melanopsin-panned RGCs. A, Differential interference contrast image of two cells from a melanopsin-panned culture and pseudocolored images of fura-2 fluorescence ratios for these cells before and after light stimulation. B, The full optical recording for these cells showing that the larger melanopsin-panned RGC (cell 1) exhibited an increased fura-2 ratio (indicative of increased [Ca2+]i) after each of two 20 s light pulses. The [Ca2+]i of the smaller “non-RGC-like” cell (cell 2) was unaffected by light. C, Multiple light responses could be elicited from the cultured cells (left trace), although some cells (6 of 18 cells) did not respond if the second stimulus was given 5 min after its preceding pulse (right trace; compare responses in two traces denoted by arrows). D, Data summary shows effect (mean Δfura-2 ratio ± SEM; n = 18 RGCs) of the interstimulus interval (5, 10, or 20 min) on the Ca2+ signals evoked by 30 s light pulses (normalized to each ipRGC's initial light response; dashed line). *p < 0.05, one-way repeated-measures ANOVA, Tukey's test, compared with responses elicited after 20 min intervals. E, Melanopsin-panned RGCs responded to both light and glutamate (30 s application) over the first few days in culture (recording on left from ipRGC on DIV 2), but their photosensitivity diminished with longer culture periods (recording on right from melanopsin-panned RGC on DIV 4). F, Representative melanopsin-panned RGCs on DIV 7 that were immunoreactive for Thy1 (green; bottom row) but not melanopsin (red; top row). These cells were from the same culture as the DIV 1 melanopsin-panned RGCs depicted in Figure 1_A_ (top row; note that Thy1-positive cells also melanopsin-positive), indicating that melanopsin protein expression had decreased.
Figure 3.
Evidence for TRPC channel involvement in ipRGC phototransduction. A, Light-evoked Ca2+ signals were reversibly blocked by the TRPC blockers 2-APB, flufenamic acid (FFA), and SKF-96365 (SKF). The decrease in the baseline fura-2 ratio by FFA is attributable to its quenching effect on 340 nm excitation, and the data for this compound were analyzed nonratiometrically. B, Fura-2 ratio trace from a cultured ipRGC in which Gd3+ inhibited the light response. hν indicates 20 s pulse of broad-spectrum light, 6.9 × 10¹³ photons/s/cm2 at 480 nm. C, Summary (means ± SEM, normalized to each ipRGC's pretreatment response) showing effects of 2-APB, SKF, FFA, La3+, and Gd3+ on light-evoked Ca2+ influx. Except for the cell depicted in A, one drug was assessed per cell. *p < 0.05; **p < 0.01, one-way repeated-measures ANOVA, Tukey's test, compared with initial responses. All responses in the presence of drugs were also significantly reduced (p < 0.05) compared with recovery (drug washout) responses, except for 100 μ
m
Gd3+. D, RT-PCR for TRPC3, TRPC6, and TRPC7 mRNA in samples prepared from melanopsin- and Thy-1-panned cells. The TRPC7-to-cyclophilin ratio was elevated in the melanopsin-panned sample.
Figure 4.
ipRGC Ca2+ responses are not attributable to Ca2+ release from intracellular stores. A, ipRGC light responses were abolished in Ca2+-free external solution. However, note the rise in [Ca2+]i after exposure to Ca2+-free HBSS (with 2 m
m
BAPTA) and after the return to regular Ca2+-containing HBSS. B, Caffeine had no effect on [Ca2+]i in ipRGCs maintained in Ca2+-free HBSS, indicating that Ca2+ stores had been emptied after exposure to zero external Ca2+. C, D, The Ca2+ stores depleting agent thapsigargin did not inhibit light-evoked [Ca2+]i elevations (C), and ipRGC light responses persisted after emptying of stores by caffeine and thapsigargin (D). For all traces, hν indicates 20 s pulse of broad-spectrum light, 6.9 × 10¹³ photons/s/cm2 at 480 nm.
Figure 5.
Primary source for the light-evoked Ca2+ signal is influx through L-type VGCCs. A, B, The L-type VGCC blockers verapamil (A) and (+)-_cis_-diltiazem inhibited the ipRGC Ca2+ responses (B). C, The N-type VGCC blocker ω-conotoxin GVIA was without significant effect. D, Blockade of action potential firing with TTX also reversibly attenuated light-induced Ca2+ responses. For all traces, hν indicates 20 s pulse of broad-spectrum light, 6.9 × 10¹³ photons/s/cm2 at 480 nm. E, Data summary (means ± SEM, normalized to pretreatment responses). **p < 0.01, one-way repeated-measures ANOVA, Tukey's test, compared with initial and recovery responses.
Figure 6.
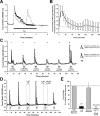
Ca2+ responses of ipRGCs exposed to light for 4 min. A, Recordings from two adjacent ipRGCs, exposed to the same light stimulus, exhibiting two distinct response patterns. For all traces (except second response in [C]) hν indicates broad-spectrum light, 6.9 × 10¹³ photons/s/cm2 at 480 nm. B, Data summary (mean ± 1 SD; n = 26) illustrating the average decay in Ca2+ responses during 4 min light stimuli. The light was turned on after the first image (0 s) and subsequent images were acquired every 10 s. The baseline-subtracted response (Δfura-2 ratio) at all time points was normalized to the each cell's peak response. C, Recording from an ipRGC exposed 6 times to 4 min light stimuli. During responses 1, 2, 3, and 6, fura-2 images were acquired every 10 s. For response 2, the standard stimulus intensity was reduced with a −1.5 log neutral density filter. During responses 4 and 5, fura-2 images were acquired every 40 and 80 s, respectively. The traces at far right represent response 3 replotted using the fura-2 ratios obtained every 40 or 80 s rather than 10 s. D, E, Example trace (D) and data summary (means ± SEM, normalized to pretreatment responses) showing effect of TTX alone and in combination with 2-APB on Ca2+ responses to the 4 min light stimuli (E). TTX was tested in 8 ipRGCs, with 2-APB plus TTX subsequently tested in five of the eight cells. **p < 0.01, one-way repeated-measures ANOVA, Tukey's test, compared with initial responses.
Figure 7.
Light-induced depolarization and action potential firing in isolated ipRGCs. A, Perforated patch-clamp (current clamp mode) recording from ipRGC. Light (broad-spectrum, 2.9 × 10¹⁴ photons/s/cm2 at 480 nm) stimulated a slow depolarization (latency, 2 s; speed, 1.1 mV/s) that triggered spike firing (top trace). The initial spike is a stimulus artifact. The intrinsic electrophysiological properties of the cell (current steps, 500 ms; ranging from −60 pA to 40 pA in 6 steps) are displayed (inset). B, Concurrent perforated patch-clamp recording and Ca2+ imaging trace obtained from an isolated ipRGC stimulated by light (broad-spectrum, 6.9 × 10¹³ photons/s/cm2 at 480 nm) for 20 s. The recording in A was recorded at room temperature (∼25°C) whereas the external solution was warmed to ∼35°C for the recording in B.
Figure 8.
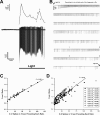
Light-stimulated Ca2+ responses are highly correlated to action potential firing frequency. A, Concurrent Ca2+ imaging trace and cell-attached patch recording for ipRGC stimulated with light (broad-spectrum, 6.9 × 10¹³ photons/s/cm2 at 480 nm) for 4 min. Fura-2 images were acquired immediately before and then every 10 s during light stimulation. B, Expanded view of the same cell-attached recording shown in A. The fura-2 ratios numbered 1–4 in A were acquired at the time points denoted by matching numbers on the cell-attached recording (B). C, Relationship of fura-2 ratios to the number of spikes in 10 s interval preceding each ratio during the 4 min light exposure for the cell depicted in A and B. D, Plot of same relationship as in (C) using data from nine light-stimulated ipRGCs. Within-cell coefficients of determination (_r_2) for each of the nine cells are shown in inset box.
Figure 9.
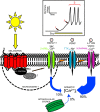
Schematic overview of light-evoked Ca2+ influx in mammalian ipRGCs. After light stimulation of melanopsin photopigment in the plasma membrane, a signaling cascade is initiated that leads to the opening of the light-gated ion channel (labeled 1). This cascade remains almost completely unknown, although there is evidence that it is G-protein dependent (Warren et al., 2006) and that protein kinase C ζ is involved (Peirson et al., 2007). The data presented in this work and that of others (Warren et al., 2006; Sekaran et al., 2007) supports the hypothesis that a TRPC channel is the light-gated ion channel, with our data supporting TRPC7 as a prime candidate. The ion flux through this 2-APB-sensitive channel depolarizes (denoted with a lightning bolt in the membrane) the membrane potential, resulting in the activation of voltage-gated Na+ channels (VGNCs; labeled 2). The Na+ flux through TTX-sensitive VGNCs during action potential firing further depolarizes the membrane, leading to the activation of verapamil-sensitive L-type VGCCs (labeled 3). The relative timing for the opening of these three channel types is illustrated in the boxed drawing that depicts the changes in membrane voltage induced by light exposure in a typical ipRGC. Although our work indicates that Ca2+ influx through the initial light-gated ion channel contributes to increased somatic [Ca2+]i during light stimulation, most of the Ca2+ signal was the result of the depolarization-induced opening of VGCCs. The presence of a membrane-associated microdomain that prevents some of the Ca2+ flux through the light-gated channel from reaching the somatic cytoplasm is also possible. Experiments involving the stores depleting agent thapsigargin indicated that contribution of intracellular Ca2+ stores to light-evoked elevations in ipRGC [Ca2+]i was negligible.
Similar articles
- Melanopsin phototransduction: beyond canonical cascades.
Contreras E, Nobleman AP, Robinson PR, Schmidt TM. Contreras E, et al. J Exp Biol. 2021 Dec 1;224(23):jeb226522. doi: 10.1242/jeb.226522. Epub 2021 Nov 29. J Exp Biol. 2021. PMID: 34842918 Free PMC article. Review. - Carbenoxolone blocks the light-evoked rise in intracellular calcium in isolated melanopsin ganglion cell photoreceptors.
Bramley JR, Wiles EM, Sollars PJ, Pickard GE. Bramley JR, et al. PLoS One. 2011;6(7):e22721. doi: 10.1371/journal.pone.0022721. Epub 2011 Jul 29. PLoS One. 2011. PMID: 21829491 Free PMC article. - M1 ipRGCs Influence Visual Function through Retrograde Signaling in the Retina.
Prigge CL, Yeh PT, Liou NF, Lee CC, You SF, Liu LL, McNeill DS, Chew KS, Hattar S, Chen SK, Zhang DQ. Prigge CL, et al. J Neurosci. 2016 Jul 6;36(27):7184-97. doi: 10.1523/JNEUROSCI.3500-15.2016. J Neurosci. 2016. PMID: 27383593 Free PMC article. - Intrinsic and extrinsic light responses in melanopsin-expressing ganglion cells during mouse development.
Schmidt TM, Taniguchi K, Kofuji P. Schmidt TM, et al. J Neurophysiol. 2008 Jul;100(1):371-84. doi: 10.1152/jn.00062.2008. Epub 2008 May 14. J Neurophysiol. 2008. PMID: 18480363 Free PMC article. - Intrinsically photosensitive retinal ganglion cells.
Pickard GE, Sollars PJ. Pickard GE, et al. Sci China Life Sci. 2010 Jan;53(1):58-67. doi: 10.1007/s11427-010-0024-5. Epub 2010 Feb 12. Sci China Life Sci. 2010. PMID: 20596956 Review.
Cited by
- Light-dependant intraretinal ion regulation by melanopsin in young awake and free moving mice evaluated with manganese-enhanced MRI.
Berkowitz BA, Roberts R, Bissig D. Berkowitz BA, et al. Mol Vis. 2010 Aug 30;16:1776-80. Mol Vis. 2010. PMID: 20808732 Free PMC article. - Simultaneous electrophysiological recording and calcium imaging of suprachiasmatic nucleus neurons.
Irwin RP, Allen CN. Irwin RP, et al. J Vis Exp. 2013 Dec 8;(82):50794. doi: 10.3791/50794. J Vis Exp. 2013. PMID: 24335611 Free PMC article. - Melanopsin phototransduction: beyond canonical cascades.
Contreras E, Nobleman AP, Robinson PR, Schmidt TM. Contreras E, et al. J Exp Biol. 2021 Dec 1;224(23):jeb226522. doi: 10.1242/jeb.226522. Epub 2021 Nov 29. J Exp Biol. 2021. PMID: 34842918 Free PMC article. Review. - A transient receptor potential-like channel mediates synaptic transmission in rod bipolar cells.
Shen Y, Heimel JA, Kamermans M, Peachey NS, Gregg RG, Nawy S. Shen Y, et al. J Neurosci. 2009 May 13;29(19):6088-93. doi: 10.1523/JNEUROSCI.0132-09.2009. J Neurosci. 2009. PMID: 19439586 Free PMC article. - Eyeing up the Future of the Pupillary Light Reflex in Neurodiagnostics.
Hall CA, Chilcott RP. Hall CA, et al. Diagnostics (Basel). 2018 Mar 13;8(1):19. doi: 10.3390/diagnostics8010019. Diagnostics (Basel). 2018. PMID: 29534018 Free PMC article. Review.
References
- Ambudkar IS, Bandyopadhyay BC, Liu X, Lockwich TP, Paria B, Ong HL. Functional organization of TRPC-Ca2+ channels and regulation of calcium microdomains. Cell Calcium. 2006;40:495–504. - PubMed
- Barres BA, Silverstein BE, Corey DP, Chun LL. Immunological, morphological, and electrophysiological variation among retinal ganglion cells purified by panning. Neuron. 1988;1:791–803. - PubMed
- Belenky MA, Smeraski CA, Provencio I, Sollars PJ, Pickard GE. Melanopsin retinal ganglion cells receive bipolar and amacrine cell synapses. J Comp Neurol. 2003;460:380–393. - PubMed
- Berson DM. Phototransduction in ganglion-cell photoreceptors. Pflugers Arch. 2007;454:849–855. - PubMed
- Berson DM, Dunn FA, Takao M. Phototransduction by retinal ganglion cells that set the circadian clock. Science. 2002;295:1070–1073. - PubMed
Publication types
MeSH terms
Substances
Grants and funding
- MH070922/MH/NIMH NIH HHS/United States
- R01 MH070922/MH/NIMH NIH HHS/United States
- R01 EY017809/EY/NEI NIH HHS/United States
- MH062296/MH/NIMH NIH HHS/United States
- R01 MH062296/MH/NIMH NIH HHS/United States
- EY017809/EY/NEI NIH HHS/United States
LinkOut - more resources
Full Text Sources
Miscellaneous


