miR-210 links hypoxia with cell cycle regulation and is deleted in human epithelial ovarian cancer - PubMed (original) (raw)
doi: 10.4161/cbt.7.2.5297. Epub 2007 Nov 14.
Raphael Sandaltzopoulos, Joel Greshock, Shun Liang, Jia Huang, Kosei Hasegawa, Chunsheng Li, Ann O'Brien-Jenkins, Dionyssios Katsaros, Barbara L Weber, Celeste Simon, George Coukos, Lin Zhang
Affiliations
- PMID: 18059191
- PMCID: PMC3233968
- DOI: 10.4161/cbt.7.2.5297
miR-210 links hypoxia with cell cycle regulation and is deleted in human epithelial ovarian cancer
Antonis Giannakakis et al. Cancer Biol Ther. 2008 Feb.
Abstract
Tumor growth results in hypoxia. Understanding the mechanisms of gene expression reprogramming under hypoxia may provide important clues to cancer pathogenesis. We studied miRNA genes that are regulated by hypoxia in ovarian cancer cell lines by TaqMan miRNA assay containing 157 mature miRNAs. MiR-210 was the most prominent miRNA consistently stimulated under hypoxic conditions. We provide evidence for the involvement of the HIF signaling pathway in miR-210 regulation. Biocomputational analysis and in vitro assays demonstrated that e2f transcription factor 3 (e2f3), a key protein in cell cycle, is regulated by miR-210. E2F3 was further confirmed to be downregulated at the protein level upon induction of miR-210. Importantly, we found remarkably high frequency of miR-210 gene copy deletions in ovarian cancer patients (64%, n = 114) and that gene copy number correlates with miR-210 expression levels. Taken together, our results indicate that miR-210 plays a crucial role in tumor onset as a key regulator of the hypoxia response and provide evidence for a link between hypoxia and the regulation of cell cycle.
Figures
Figure 1. Differential expression of 157 miRs in hypoxia. A–C
Expression levels of mature miRs (by a Taqman miRNA assay kit, ABI) in two ovarian cancer cell lines (SKOV3 and 2008) and in a HeLa cell line incubated under hypoxia-inducing conditions (1.5% O2, 16 hours) relative to their expression under oxygen availability. The relative quantity of each miR was estimated using the ΔΔCt method by normalizing to endogenous U6. MiRs exhibiting greater than a 2 fold up-regulation are highlighted in red, miRs showing greater than a 2 fold down-regulation are colored green and miRs with unchanged expression levels are shown in gray. MiRs are ordered from left to right according to their relative expression in hypoxia. D. Venn diagram of miRs which are upregulated significantly in hypoxia. Only miR-210 was common in all three cancer cell lines. E. Validation of miR-210 up-regulation under hypoxia in all three cancer cell lines by an independent qPCR assay.
Figure 2. Evidence for HTF-dependent induction of miR-210
The expression level of the mature miR-210 in a pVHL deficient renal carcinoma cell line (RCC4) is compromised upon expression of functional pVHL by stable transfection (RCC4-T3/14) under oxic conditions (A) and, to a lesser extend, under hypoxic conditions (B). HIF-1 and HIF-2 factors are constitutively active in the RCC4 but not in the RCC4 (T3/14) cell line. The relative quantity of miR-210 was estimated using the ΔΔCt method by normalizing to endogenous U6 C. MiR-210 promoter analysis indicating the presence of 5 putative HIF binding sites. The capital letters in the HIF binding sequences denote the core nucleotides of the HRE matrices.
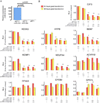
Figure 3. Mir-210 target validation
A. Efficient ectopic expression of the mature miR-210 in HeLa cells upon transfection with a pEF1/_Myc_-His C construct engineered to express miR-210. Mature miR-210 concentration was quantified by a Taqman miRNA assay according to the ΔΔCt method, using U6 levels for normalization. In the negative control reactions, the relative quantity of miR-210 was also monitored in cells transfected with the same vector expressing miR-30a or the empty vector. B. Effect of miR-210 overexpression on its predicted RNA targets monitored by luciferase assays. For each RNA species tested, a 3’ UTR fragment encompassing the predicted miR-210 target site was cloned into the luciferase reporter vector psiCHECK-2. Each psiCHECKA/target construct (0.5 µg) was co-transfected with two different amounts (0.5 and 1 µg) of pEF1/miR-210 in HeLa cells. The pEF1/miR-210 construct was also co-transfected with the empty psiCHECK-2 vector as negative control. Measurements taken 24 or 48 hours after transfection are represented as red or yellow bars respectively. The difference of expression levels was confirmed by t-test statistical analysis (one asterisk: p<0.05, two asterisks: p<0.01).
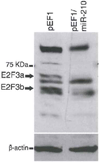
Figure 4. MiR-210 targets both isoforms of E2F3
Western blotting showing that transfection of HeLa cells with the miR-210 expressing construct (pEF1/miR-210) resulted in the elimination of both E2F3 isoforms (E2F3a and E2F3b) at the protein level. Transfection of HeLa cells with the empty vector pEF1 was used as control. Endogenous actin served as recovery control.
Figure 5. Frequent miR-210 gene copy loss in ovarian cancer
A. Real time PCR based, gene copy number assay (18 ovarian cancer cell lines, 4 IOSE cell lines and 5 blood samples from healthy donors) using two Taqman primers designed to bind to genomic DNA, one inside the precursor miR-210 and the other ~4 Kb further upstream. For each sample, the average estimated copy number (vertical axis) was derived from the two measurements with the independent probes and it was then plotted against the gene copy number estimated solely by using the primer that probes within the precursor miR-210 (horizontal axis). Ovarian cancer cell lines with gene copy loss are represented by rectangles while those with normal copy number are shown as horizontal bars. IOSE cell lines and the healthy donors samples are represented by circles. B. Gene copy number assay using the Taqman probe that anneals within the precursor miR-210 in 114 ovarian cancer samples. MiR-210 was normalized to tbp and then the gene copy number was estimated with reference to the average ΔCt value of the 5 healthy donors’ samples by multiplying the relative quantity by a factor of two (since tbp is present in two copies). Samples that fell within the range of 2 ± 0.8 (standard deviation) were considered to have a normal gene copy number. C. Correlation of the estimated miR-210 copy number and the relative expression levels of mature miR-210 in the same 114 ovarian cancer samples as in (B).
Comment in
- Hypoxic regulation of miR-210: shrinking targets expand HIF-1's influence.
Corn PG. Corn PG. Cancer Biol Ther. 2008 Feb;7(2):265-7. doi: 10.4161/cbt.7.2.5745. Epub 2008 Feb 18. Cancer Biol Ther. 2008. PMID: 18347426 No abstract available.
Similar articles
- Hypoxic regulation of miR-210: shrinking targets expand HIF-1's influence.
Corn PG. Corn PG. Cancer Biol Ther. 2008 Feb;7(2):265-7. doi: 10.4161/cbt.7.2.5745. Epub 2008 Feb 18. Cancer Biol Ther. 2008. PMID: 18347426 No abstract available. - The hypoxia-related microRNA miR-199a-3p displays tumor suppressor functions in ovarian carcinoma.
Kinose Y, Sawada K, Nakamura K, Sawada I, Toda A, Nakatsuka E, Hashimoto K, Mabuchi S, Takahashi K, Kurachi H, Lengyel E, Kimura T. Kinose Y, et al. Oncotarget. 2015 May 10;6(13):11342-56. doi: 10.18632/oncotarget.3604. Oncotarget. 2015. PMID: 25839163 Free PMC article. - Hypoxia-induced miR-210 in epithelial ovarian cancer enhances cancer cell viability via promoting proliferation and inhibiting apoptosis.
Li L, Huang K, You Y, Fu X, Hu L, Song L, Meng Y. Li L, et al. Int J Oncol. 2014 Jun;44(6):2111-20. doi: 10.3892/ijo.2014.2368. Epub 2014 Apr 4. Int J Oncol. 2014. PMID: 24715221 - MiRNA-210: A Current Overview.
Bavelloni A, Ramazzotti G, Poli A, Piazzi M, Focaccia E, Blalock W, Faenza I. Bavelloni A, et al. Anticancer Res. 2017 Dec;37(12):6511-6521. doi: 10.21873/anticanres.12107. Anticancer Res. 2017. PMID: 29187425 Review. - Epithelial-mesenchymal transition-associated miRNAs in ovarian carcinoma, with highlight on the miR-200 family: prognostic value and prospective role in ovarian cancer therapeutics.
Koutsaki M, Spandidos DA, Zaravinos A. Koutsaki M, et al. Cancer Lett. 2014 Sep 1;351(2):173-81. doi: 10.1016/j.canlet.2014.05.022. Epub 2014 Jun 18. Cancer Lett. 2014. PMID: 24952258 Review.
Cited by
- Paternal Benzo[a]pyrene Exposure Modulates MicroRNA Expression Patterns in the Developing Mouse Embryo.
Brevik A, Lindeman B, Brunborg G, Duale N. Brevik A, et al. Int J Cell Biol. 2012;2012:407431. doi: 10.1155/2012/407431. Epub 2012 Apr 4. Int J Cell Biol. 2012. PMID: 22548065 Free PMC article. - On the Pro-Metastatic Stress Response to Cancer Therapies: Evidence for a Positive Co-Operation between TIMP-1, HIF-1α, and miR-210.
Cui H, Grosso S, Schelter F, Mari B, Krüger A. Cui H, et al. Front Pharmacol. 2012 Jul 12;3:134. doi: 10.3389/fphar.2012.00134. eCollection 2012. Front Pharmacol. 2012. PMID: 22807917 Free PMC article. - A Comparative Analysis of Genetic and Epigenetic Events of Breast and Ovarian Cancer Related to Tumorigenesis.
Longacre M, Snyder NA, Housman G, Leary M, Lapinska K, Heerboth S, Willbanks A, Sarkar S. Longacre M, et al. Int J Mol Sci. 2016 May 18;17(5):759. doi: 10.3390/ijms17050759. Int J Mol Sci. 2016. PMID: 27213343 Free PMC article. Review. - Multiple E2F-induced microRNAs prevent replicative stress in response to mitogenic signaling.
Bueno MJ, Gómez de Cedrón M, Laresgoiti U, Fernández-Piqueras J, Zubiaga AM, Malumbres M. Bueno MJ, et al. Mol Cell Biol. 2010 Jun;30(12):2983-95. doi: 10.1128/MCB.01372-09. Epub 2010 Apr 19. Mol Cell Biol. 2010. PMID: 20404092 Free PMC article. - MicroRNA-210 as a novel therapy for treatment of ischemic heart disease.
Hu S, Huang M, Li Z, Jia F, Ghosh Z, Lijkwan MA, Fasanaro P, Sun N, Wang X, Martelli F, Robbins RC, Wu JC. Hu S, et al. Circulation. 2010 Sep 14;122(11 Suppl):S124-31. doi: 10.1161/CIRCULATIONAHA.109.928424. Circulation. 2010. PMID: 20837903 Free PMC article.
References
- Beissbarth T, Speed TP. GOstat: find statistically overrepresented Gene Ontologies within a group of genes. Bioinformatics. 2004;20:1464–1465. - PubMed
- Bentwich I, Avniel A, Karov Y, Aharonov R, Gilad S, Barad O, Barzilai A, Einat P, Einav U, Meiri, et al. Identification of hundreds of conserved and nonconserved human microRNAs. Nature Genetics. 2005;37:766–770. - PubMed
- Beth LP, Roberto R, Daniel M, Adi LT, Yu Mi H, Yeon Mee K, Sorin D, Jimmy E, Juan Pedro K, Pooja M, et al. Distinct subsets of microRNAs are expressed differentially in the human placentas of patients with preeclampsia. American journal of obstetrics and gynecology. 2007;196:261.e261–261.e266. - PubMed
Publication types
MeSH terms
Substances
LinkOut - more resources
Full Text Sources
Other Literature Sources
Medical


