Capturing cell-fate decisions from the molecular signatures of a receptor-dependent signaling response - PubMed (original) (raw)
Capturing cell-fate decisions from the molecular signatures of a receptor-dependent signaling response
Dhiraj Kumar et al. Mol Syst Biol. 2007.
Abstract
We examined responses of the B-cell antigen receptor-dependent intracellular signaling network to targeted perturbations induced through siRNA-mediated depletion of select signaling intermediates. The constituent nodes displayed graded sensitivities, which resulted from the differential effects of perturbations on the kinetic and quantitative aspects of phosphorylation at each node. By taking the rate of initial phosphorylation, rate of subsequent dephosphorylation, and the total intensity of phosphorylation at each node as separate signaling parameters, we generated data-driven models that accurately predicted the cellular responses of apoptosis, proliferation, and cytokine secretion. Importantly, the effects of perturbation on the primary target alone did not yield successful models. Rather, it also required incorporation of secondary effects on many other nodes. A significant feature of these models was that the three signaling parameters derived from each node functioned largely as independent entities, making distinctive contributions to the cellular response. Thus, the kinetic and quantitative features of phosphorylation at a node appear to play discrete roles during signal processing.
Figures
Figure 1
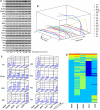
Signaling from the B-cell receptor and the effects of individual perturbations. (A) Phosphorylation profiles obtained for the selected signaling molecules from one of four separate experiments. The phosphorylation site-specific antibodies used are listed in Supplementary Table S6, along with the relevant references. The western blots obtained were then normalized using our MATLAB Toolbox as described in Supplementary Figure S1. The resulting plots for all the signaling molecules are shown in (B) (_Z_-axis value ranges from 100 to 3000). (C) Effects of siRNA-mediated depletion of either CaMKII, PKCδ, PLCγ, or Pyk2 on the time-dependent phosphorylation profiles of a representative panel of signaling intermediates. For comparative purposes, the corresponding profiles obtained in mock-siRNA-treated cells (see Materials and methods) are also shown. Each bar represents the extent of phosphorylation obtained at the indicated time point, and the values were obtained after applying the normalization procedure on three separate experiments as described in Supplementary Figure S1. (D) Summarized results, in the form of a heat map, of a microarray analysis of gene expression under various perturbation conditions indicated. (List of genes in the order of their up- or downregulation is given in Supplementary Table S7.)
Figure 2
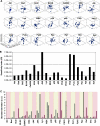
Signaling nodes display graded sensitivities to diverse network perturbations. As described in the text, we first obtained the phosphorylation profiles for each of the 21 signaling molecules, under the 21 independent conditions of perturbation. Results obtained from three such experiments were then taken to generate a normalized profile (as described for Figure 1B) for each signaling molecule and each perturbation condition. Individual profiles were then taken for deriving the values of _S_max/_t_max, decay rate, and the total area under the curve. (A) Spread of the values obtained, for each of these signaling intermediates, under the 21 separate conditions of perturbation. This distribution is shown in the form of a three-dimensional (3D) box for each intermediate, and each data point corresponds to the values of the three signaling parameters obtained, for a given perturbation condition. The extent of spread in the distribution provides a relative measure of the sensitivity of a given node to the various perturbations. (B) Quantitative differences in nodal sensitivity, represented here as sensitivity index (SI), which was calculated by measuring distance in the 3D parametric space traveled by the node in response to the various perturbations. (C) Standard deviation for all the three parameters of each node under all the perturbation conditions (sequence of parameters for any given node in the graph is area, decay rate, and _S_max/_t_max). Each colored segment of this graph specifies a given node (indicated on the _X_-axis) with the three corresponding bars describing (from left to right) the deviations in area, _S_max/_t_max, and decay rate, respectively.
Figure 3
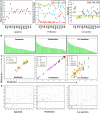
Perturbation-induced alteration in cellular responses and their analysis by data-driven modeling. (A) Anti-IgG-dependent cell responses obtained for the various siRNA-treated cells, when measured either as protection against Fas-induced apoptosis, proliferation, or IL-2 secretion. The 15 molecules separately depleted for these experiments are indicated on the _X_-axis. The color of the closed circle indicates the time point at which that particular measurement was made, and the colored lines in each box indicates the corresponding value obtained in mock siRNA-treated cells, at the indicated time point. Proliferation was measured as the percent of total cells in cycle, whereas apoptosis is described as the percent of Fas-stimulated cells that were rescued from apoptosis when cells were also simultaneously stimulated with anti-IgG. In this latter case, negative values indicate enhancement of apoptosis when the relevant signaling intermediate was depleted. Values are from one of three (cytokine), or two (proliferation and apoptosis) separate determinations. (B) Ranking of the individual VIPs in the descending order of their significance for the three different responses as indicated. (Parameters along with their respective VIP values for all the three responses are listed in decreasing order in Supplementary Table S10.) (C) Distribution of the observed versus predicted values along the regression line, for the three independent responses. The color code used for the various time points is indicated. (D) Results of the validation of our model based on 20 different iterations of the data set corresponding to each of the cellular responses. The green line represents R2 values, whereas the blue line represents the Q2 values.
Figure 4
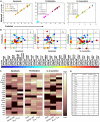
Validating the PLS model and defining response-specific VIP fingerprints. Cellular responses were generated for the six additional perturbation conditions (siRNA for Bad, BLNK, CaMKII, ERK, Raf, and Shc), and the resulting values were incorporated into the PLS model as described in the text. A comparison of the predicted versus the experimentally determined (mean of three experiments±s.d.) values for each of the responses is shown in (A). (B) Distribution of signaling parameters—as VIPs—in the three combinatorially possible two-dimensional spaces (see text for details). The color of each closed circle represents a numerical calibration of the respective VIPs, along all the three response axes and their identity is described by the colored bar shown below. (C) VIP distribution as a fingerprint for the three separate responses. Included in this fingerprint is a color-coded indication of the relative importance of a given VIP, the scale of which is described by the pseudo-color bar. (D) Minimal necessary nodal features required to generate a valid model for each of the three responses are tabulated (see text for details).
Figure 5
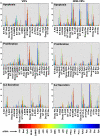
Specificity versus sensitivity of signaling parameters toward cellular response. The siRNA-induced variations in values of the individual signaling parameters are depicted here. Values are shown in terms of their fold variation over that obtained for the corresponding parameter in cells treated with mock siRNA. These results are depicted in the form of a comparison between specific top-scoring VIPs from the minimal model (left panel) and non-VIPs (right panel). In these graphs, the signaling parameters are indicated on the _X_-axis, and the 21-perturbation conditions are described by the reference color bar.
Figure 6
Pharmacological inhibitors as treatment conditions for measuring signaling parameters. (A) Observed versus predicted scatter plot for anti-IgG-dependent apoptosis response following treatment with the various pharmacological inhibitors described in the text. Values for only those VIPs extracted by the minimal model described in Figure 4D were taken to predict cellular responses here. (B) Projection of the various inhibitors, and the corresponding siRNAs, treatment conditions as separate perturbation conditions on a plane consisting of the top two principle components t1 and t2. The latter were obtained in a separate principle component analysis. The scores plot (treatment conditions) on the t1 versus t2 axes shows distinct clustering of inhibitor- and siRNA-treatment conditions, respectively. (C) Projection of the corresponding apoptotic responses following treatment with either siRNA or pharmacological inhibitors (as described for B) on a similar plot. The numbers used are identical to that described in (B).
Figure 7
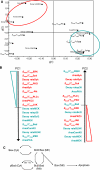
A response axis based on the signaling parameters for apoptosis. (A) Distribution of signaling parameters onto principle components 1 and 2 for the apoptotic response. The shaded areas show the two clusters of signaling parameters identified. (B) Arrangement of signaling parameters, in a descending order, on the two principle components, respectively. Parameters shown in red were positively correlated with apoptosis, while those in blue were negatively correlated with apoptosis. (C) Schematic representation of a cellular apoptotic response module consisting of three nodes, Bad, Bcl2 and Bax. Bax, a known pro-apoptotic protein is mainly cytoplasmic (Cyt) before being recruited to mitochondria (Mit), a process dependent on Ser70 phosphorylation of Bcl2. In mitochondria, Bad can displace Bax from the Bcl2-Bax complex, thereby promoting apoptosis through the oligomerization of Bax. Phosphorylation of Bad at either Ser112 or Ser136, however, leads to inhibition of this activity. As a result, Bad translocates to the cytoplasm where it is then sequestered by the chaperone 14-3-3, leading to inhibition/reduction of apoptosis.
Similar articles
- Integration of signals from the B-cell antigen receptor and the IL-4 receptor leads to a cooperative shift in the cellular response axis.
Aflakian N, Ravichandran S, Jamal MS, Jarvenpaa H, Lahesmaa R, Rao KV. Aflakian N, et al. Mol Biosyst. 2009 Dec;5(12):1661-71. doi: 10.1039/b901992h. Epub 2009 May 5. Mol Biosyst. 2009. PMID: 19452046 - Btk/Tec kinases regulate sustained increases in intracellular Ca2+ following B-cell receptor activation.
Fluckiger AC, Li Z, Kato RM, Wahl MI, Ochs HD, Longnecker R, Kinet JP, Witte ON, Scharenberg AM, Rawlings DJ. Fluckiger AC, et al. EMBO J. 1998 Apr 1;17(7):1973-85. doi: 10.1093/emboj/17.7.1973. EMBO J. 1998. PMID: 9524120 Free PMC article. - Requirement for a hsp90 chaperone-dependent MEK1/2-ERK pathway for B cell antigen receptor-induced cyclin D2 expression in mature B lymphocytes.
Piatelli MJ, Doughty C, Chiles TC. Piatelli MJ, et al. J Biol Chem. 2002 Apr 5;277(14):12144-50. doi: 10.1074/jbc.M200102200. Epub 2002 Jan 31. J Biol Chem. 2002. PMID: 11823472 - B cell signaling in context.
Kwak K, Akkaya M, Pierce SK. Kwak K, et al. Nat Immunol. 2019 Aug;20(8):963-969. doi: 10.1038/s41590-019-0427-9. Epub 2019 Jul 8. Nat Immunol. 2019. PMID: 31285625 Review. - Molecular mechanisms of B cell antigen receptor trafficking.
Clark MR, Massenburg D, Zhang M, Siemasko K. Clark MR, et al. Ann N Y Acad Sci. 2003 Apr;987:26-37. doi: 10.1111/j.1749-6632.2003.tb06030.x. Ann N Y Acad Sci. 2003. PMID: 12727621 Review.
Cited by
- Quantitative modeling of signaling in aggressive B cell lymphoma unveils conserved core network.
Klinger B, Rausch I, Sieber A, Kutz H, Kruse V, Kirchner M, Mertins P, Kieser A, Blüthgen N, Kube D. Klinger B, et al. PLoS Comput Biol. 2024 Oct 1;20(10):e1012488. doi: 10.1371/journal.pcbi.1012488. eCollection 2024 Oct. PLoS Comput Biol. 2024. PMID: 39352924 Free PMC article. - NF-kB in Signaling Patterns and Its Temporal Dynamics Encode/Decode Human Diseases.
Almowallad S, Alqahtani LS, Mobashir M. Almowallad S, et al. Life (Basel). 2022 Dec 2;12(12):2012. doi: 10.3390/life12122012. Life (Basel). 2022. PMID: 36556376 Free PMC article. Review. - Effective Combination Therapies for B-cell Lymphoma Predicted by a Virtual Disease Model.
Du W, Goldstein R, Jiang Y, Aly O, Cerchietti L, Melnick A, Elemento O. Du W, et al. Cancer Res. 2017 Apr 15;77(8):1818-1830. doi: 10.1158/0008-5472.CAN-16-0476. Epub 2017 Jan 27. Cancer Res. 2017. PMID: 28130226 Free PMC article. - TNF-insulin crosstalk at the transcription factor GATA6 is revealed by a model that links signaling and transcriptomic data tensors.
Chitforoushzadeh Z, Ye Z, Sheng Z, LaRue S, Fry RC, Lauffenburger DA, Janes KA. Chitforoushzadeh Z, et al. Sci Signal. 2016 Jun 7;9(431):ra59. doi: 10.1126/scisignal.aad3373. Sci Signal. 2016. PMID: 27273097 Free PMC article. - Forecasting cell death dose-response from early signal transduction responses in vitro.
Vrana JA, Currie HN, Han AA, Boyd J. Vrana JA, et al. Toxicol Sci. 2014 Aug 1;140(2):338-51. doi: 10.1093/toxsci/kfu089. Epub 2014 May 13. Toxicol Sci. 2014. PMID: 24824809 Free PMC article.
References
- Barabasi AL, Oltvai ZN (2004) Network biology: understanding the cell's functional organization. Nat Rev Genet 5: 101–113 - PubMed
- Bauman AL, Scott JD (2002) Kinase- and phosphatase-anchoring proteins: harnessing the dynamic duo. Nat Cell Biol 4: E203–E206 - PubMed
- Bhalla US, Iyengar R (1999) Emergent properties of networks of biological signaling pathways. Science 283: 381–387 - PubMed
Publication types
MeSH terms
Substances
LinkOut - more resources
Full Text Sources
