Combining efficient conformational sampling with a deformable elastic network model facilitates structure refinement at low resolution - PubMed (original) (raw)
Combining efficient conformational sampling with a deformable elastic network model facilitates structure refinement at low resolution
Gunnar F Schröder et al. Structure. 2007 Dec.
Abstract
Structural studies of large proteins and protein assemblies are a difficult and pressing challenge in molecular biology. Experiments often yield only low-resolution or sparse data that are not sufficient to fully determine atomistic structures. We have developed a general geometry-based algorithm that efficiently samples conformational space under constraints imposed by low-resolution density maps obtained from electron microscopy or X-ray crystallography experiments. A deformable elastic network (DEN) is used to restrain the sampling to prior knowledge of an approximate structure. The DEN restraints dramatically reduce over-fitting, especially at low resolution. Cross-validation is used to optimally weight the structural information and experimental data. Our algorithm is robust even for noise-added density maps and has a large radius of convergence for our test case. The DEN restraints can also be used to enhance reciprocal space simulated annealing refinement.
Figures
Figure 1
Test case for sampling simulations. The goal is to fit a target electron density map by smoothly deforming a starting structure. The test structure is RBP consisting of 271 amino acid residues for which two different structures have been solved by X-ray crystallography in an open (PDB entry 2DRI, in orange) and a closed (1URP, in green) conformation. The refinement starts from the open conformation, which has a RMSD of 4.3 Å to the closed conformation. Synthetic density maps are calculated at different resolutions (_d_min = 3, 4, 6, 8 10, 15, and 20 Å) from the closed conformation and used in our refinement approach as ‘experimental’ data. The density map computed to _d_min = 10 Å is shown in blue.
Figure 2
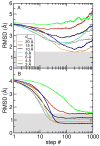
Sampling simulations without and with DEN restraints. All-atom RMSD are computed with respect to the target (closed) conformation of RBP for sampling simulations starting from the open conformation and using electron density maps computed at seven different resolutions (_d_min = 3, 4, 6, 8, 10, 15, and 20 Å). (A) Free sampling simulation without DEN. (B) Sampling simulations using the DEN restraints with γ = 0.8. With the DEN restraints, all simulations yielded structures with RMSDs below 1.5 Å (indicated by the grey shaded region).
Figure 3
Effect of the γ value on the sampling simulations. For each of the seven density map resolutions, we performed a series of eleven simulations with the γ value (Eqs. 5 and 6) varying between 0 and 1 in steps of 0.1. All-atom RMSD are shown, averaged over the last 500 steps of each refinement simulation (1000 steps total each). The smallest RMSD value that can be achieved depends on the γ value. The optimum choice for γ is different for different resolutions.
Figure 4
Use of cross-validation data set to determine the optimum value of the γ value. (A), (B) The cross-validation data set is formed by selecting at random 10% of the structure factors that were omitted from the calculation of the density map used to guide the sampling simulations. These omitted structure factors are then used to calculate a free R value (Free-R) that measures the fit between the structure factors calculated from the sampled structure and the omitted structure factors. The curves of , the RMSD averaged over the last 500 steps of each refinement simulation, versus γ differs from those of free R against γ, but the minimum of free R at a particular resolution occurs at a γ value that is close to that which minimizes the value. This provides an approximate method to determine the optimum γ value. In panels (C) and (D) we show how noise effects the variation of with the γ parameter. Adding Gaussian noise with a standard deviation of 40° to the phases of the structures factors has a very small effect at all resolutions. We have marked the minimum values of either or free-R by square symbols to better show the correspondence of the positions.
Figure 5
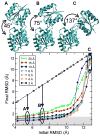
Radius of convergence of DireX as a function of density map resolution. The open conformation of RBP (PDB ID 1URP) has been manually opened to different extents to yield 18 structures with an inter-domain angle of between 41° and 137°, and corresponding RMSD values between 4.3 Å and 12.7 Å, with respect to the closed conformation (PDB ID 2DRI). Three of these different starting structures (A, B, C) with RMSD values of 5.4, 7.2, and 12.7 Å, respectively, are shown. The final RMSD value after the sampling simulation is plotted against the initial RMSD value. Points that lie below the diagonal (dashed line) correspond to starting structures that have been moved closer to the correct structure by sampling simulations against the density map computed to the particular resolution.
Figure 6
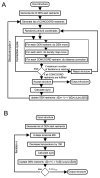
Implementation of DEN. (A) Diagram showing the implementation of DEN in combination with the CONCOORD algorithm in the program DireX. (B) Diagram showing the implementation of DEN in reciprocal space simulated annealing refinement.
Figure 7
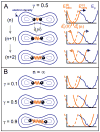
Illustration of DEN for an example with two atoms. The elastic network potential is represented by a spring (orange) between two atoms (black balls) separated by a distance of dij (n) for the atom pair (i,j) at sampling step n. The density map contours are represented by blue iso-contours. The energy terms involved are depicted in the diagrams on the right. The current equilibrium distance dij0(n) of the DEN potential, EDEN(n), can change at each sampling step n. The blue curve shows the rugged pseudo-energy Eρ (see Experimental Procedures), which is minimal for the best fit of the model density to the target density map. At the start of the sampling simulation process, the distance of the atoms dij0(0) in the starting model is at the minimum of the DEN potential, EDEN(0) (dashed orange line). As the elastic network deforms by changing the equilibrium distance dij0(0) to dij0(n), the DEN potential, EDEN(n), also changes (solid orange line). (A) Three steps (n, n+1, and n+2) of a sampling simulation are shown for the parameter γ = 0.5. In the starting model, the two atoms are close to each other. During the sampling simulation the atoms are pulled into higher density regions. The DEN potential adapts to this force up to an extent that is controlled by γ (see Eq. 5 in Experimental Procedures). (B) shows the final converged states of three different sampling simulations for different γ-values (0.1, 0.5, 0.9). The larger the value of γ, the more the DEN is able to adapt to the forces imposed by the density map.
Similar articles
- Deformable complex network for refining low-resolution X-ray structures.
Zhang C, Wang Q, Ma J. Zhang C, et al. Acta Crystallogr D Biol Crystallogr. 2015 Nov;71(Pt 11):2150-7. doi: 10.1107/S139900471501528X. Epub 2015 Oct 27. Acta Crystallogr D Biol Crystallogr. 2015. PMID: 26527134 Free PMC article. - Deformable elastic network refinement for low-resolution macromolecular crystallography.
Schröder GF, Levitt M, Brunger AT. Schröder GF, et al. Acta Crystallogr D Biol Crystallogr. 2014 Sep;70(Pt 9):2241-55. doi: 10.1107/S1399004714016496. Epub 2014 Aug 29. Acta Crystallogr D Biol Crystallogr. 2014. PMID: 25195739 Free PMC article. - Real-space refinement with DireX: from global fitting to side-chain improvements.
Wang Z, Schröder GF. Wang Z, et al. Biopolymers. 2012 Sep;97(9):687-97. doi: 10.1002/bip.22046. Biopolymers. 2012. PMID: 22696405 - High-resolution modeling of protein structures based on flexible fitting of low-resolution structural data.
Zheng W, Tekpinar M. Zheng W, et al. Adv Protein Chem Struct Biol. 2014;96:267-84. doi: 10.1016/bs.apcsb.2014.06.004. Epub 2014 Aug 24. Adv Protein Chem Struct Biol. 2014. PMID: 25443961 Review. - Refinement of Atomic Structures Against cryo-EM Maps.
Murshudov GN. Murshudov GN. Methods Enzymol. 2016;579:277-305. doi: 10.1016/bs.mie.2016.05.033. Epub 2016 Jun 24. Methods Enzymol. 2016. PMID: 27572731 Review.
Cited by
- Improving the accuracy of macromolecular structure refinement at 7 Å resolution.
Brunger AT, Adams PD, Fromme P, Fromme R, Levitt M, Schröder GF. Brunger AT, et al. Structure. 2012 Jun 6;20(6):957-66. doi: 10.1016/j.str.2012.04.020. Structure. 2012. PMID: 22681901 Free PMC article. - Super-resolution biomolecular crystallography with low-resolution data.
Schröder GF, Levitt M, Brunger AT. Schröder GF, et al. Nature. 2010 Apr 22;464(7292):1218-22. doi: 10.1038/nature08892. Epub 2010 Apr 7. Nature. 2010. PMID: 20376006 Free PMC article. - Analyses of subnanometer resolution cryo-EM density maps.
Baker ML, Baker MR, Hryc CF, Dimaio F. Baker ML, et al. Methods Enzymol. 2010;483:1-29. doi: 10.1016/S0076-6879(10)83001-0. Methods Enzymol. 2010. PMID: 20888467 Free PMC article. - Searching for 3D structural models from a library of biological shapes using a few 2D experimental images.
Tiwari SP, Tama F, Miyashita O. Tiwari SP, et al. BMC Bioinformatics. 2018 Sep 12;19(1):320. doi: 10.1186/s12859-018-2358-0. BMC Bioinformatics. 2018. PMID: 30208849 Free PMC article. - Mechanism of folding chamber closure in a group II chaperonin.
Zhang J, Baker ML, Schröder GF, Douglas NR, Reissmann S, Jakana J, Dougherty M, Fu CJ, Levitt M, Ludtke SJ, Frydman J, Chiu W. Zhang J, et al. Nature. 2010 Jan 21;463(7279):379-83. doi: 10.1038/nature08701. Nature. 2010. PMID: 20090755 Free PMC article.
References
- Bjorkman AJ, Binnie RA, Zhang H, Cole LB, Hermodson MA, Mowbray SL. Probing protein-protein interactions. The ribose-binding protein in bacterial transport and chemotaxis. J Biol Chem. 1994;269:30206–30211. - PubMed
- Bjorkman AJ, Mowbray SL. Multiple open forms of ribose-binding protein trace the path of its conformational change. J Mol Biol. 1998;279:651–664. - PubMed
- Brunger AT, Kuriyan J, Karplus M. Crystallographic R factor refinement by molecular dynamics. Science. 1987;235:458–460. - PubMed
- Brunger AT. The free R value: a novel statistical quantity for assessing the accuracy of crystal structures. Nature. 1992;355:472–474. - PubMed
- Brunger AT. Assessment of phase accuracy by cross validation: the free R value. Methods and applications Acta Crystallogr. 1993;D49:24–36. - PubMed
Publication types
MeSH terms
Grants and funding
- GM-41455/GM/NIGMS NIH HHS/United States
- R37 GM041455-19/GM/NIGMS NIH HHS/United States
- R01 GM041455/GM/NIGMS NIH HHS/United States
- PN2 EY016525/EY/NEI NIH HHS/United States
- R01 GM063817/GM/NIGMS NIH HHS/United States
- U54 GM072970/GM/NIGMS NIH HHS/United States
- PN2 EY016525-04/EY/NEI NIH HHS/United States
- U54 GM072970-04/GM/NIGMS NIH HHS/United States
- R37 GM041455/GM/NIGMS NIH HHS/United States
LinkOut - more resources
Full Text Sources


