Inferring human population sizes, divergence times and rates of gene flow from mitochondrial, X and Y chromosome resequencing data - PubMed (original) (raw)
. 2007 Dec;177(4):2195-207.
doi: 10.1534/genetics.107.077495.
Sarah B Kingan, Maya M Pilkington, Jason A Wilder, Murray P Cox, Himla Soodyall, Beverly Strassmann, Giovanni Destro-Bisol, Peter de Knijff, Andrea Novelletto, Jonathan Friedlaender, Michael F Hammer
Affiliations
- PMID: 18073427
- PMCID: PMC2219499
- DOI: 10.1534/genetics.107.077495
Inferring human population sizes, divergence times and rates of gene flow from mitochondrial, X and Y chromosome resequencing data
Daniel Garrigan et al. Genetics. 2007 Dec.
Abstract
We estimate parameters of a general isolation-with-migration model using resequence data from mitochondrial DNA (mtDNA), the Y chromosome, and two loci on the X chromosome in samples of 25-50 individuals from each of 10 human populations. Application of a coalescent-based Markov chain Monte Carlo technique allows simultaneous inference of divergence times, rates of gene flow, as well as changes in effective population size. Results from comparisons between sub-Saharan African and Eurasian populations estimate that 1500 individuals founded the ancestral Eurasian population approximately 40 thousand years ago (KYA). Furthermore, these small Eurasian founding populations appear to have grown much more dramatically than either African or Oceanian populations. Analyses of sub-Saharan African populations provide little evidence for a history of population bottlenecks and suggest that they began diverging from one another upward of 50 KYA. We surmise that ancestral African populations had already been geographically structured prior to the founding of ancestral Eurasian populations. African populations are shown to experience low levels of mitochondrial DNA gene flow, but high levels of Y chromosome gene flow. In particular, Y chromosome gene flow appears to be asymmetric, i.e., from the Bantu-speaking population into other African populations. Conversely, mitochondrial gene flow is more extensive between non-African populations, but appears to be absent between European and Asian populations.
Figures
Figure 1.—
Map showing the geographical locations of the 10 human populations sampled for DNA resequencing in this study.
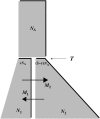
Figure 2.—
A schematic of the isolation-with-migration (IM) model. The IM model includes two populations that diverge from one another at time T from a common ancestral population of size _N_A. After time T, the ancestral population splits into two daughter populations, one of size _sN_A and the other of size (1 − s)_N_A. The populations are allowed to grow (or shrink) exponentially until the current generation. Over the course of these T generations, gene flow can occur between the two populations and can occur at different rates in each direction.
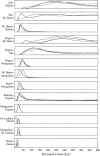
Figure 3.—
Posterior probability distributions for the divergence time parameter in the IM model in 13 pairwise population comparisons. Each curve represents an independent run of the MCMC algorithm. The timescale shown at the bottom is in thousands of years before the present.
Figure 4.—
Comparison between the distributions of _F_ST values predicted between African and non-African populations (A), under the inferred parameters of the IM model, and those observed at 50 autosomal loci resequenced by V
oight
et al. (2005). (B) The predicted and observed distributions of _F_ST between European and Asian populations. The predicted and observed distributions of Tajima's D statistic are also given for the African population (C) and the Asian population (D).
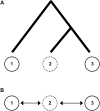
Figure 5.—
A schematic to illustrate the effect of gene flow with unsampled populations. In A, although populations 2 and 3 are more closely related, population 2 only exchanges genes with the more distantly related population 1. If only populations 1 and 3 are sampled (solid circles), this combination of factors may result in a misleading signal of asymmetrical gene flow between populations 1 and 3. However, if gene flow can occur between all populations (sampled or unsampled), as in the linear stepping stone model in B, no such misleading pattern of asymmetrical gene flow is expected.
Similar articles
- Contrasting signatures of population growth for mitochondrial DNA and Y chromosomes among human populations in Africa.
Pilkington MM, Wilder JA, Mendez FL, Cox MP, Woerner A, Angui T, Kingan S, Mobasher Z, Batini C, Destro-Bisol G, Soodyall H, Strassmann BI, Hammer MF. Pilkington MM, et al. Mol Biol Evol. 2008 Mar;25(3):517-25. doi: 10.1093/molbev/msm279. Epub 2007 Dec 18. Mol Biol Evol. 2008. PMID: 18093995 - Carriers of mitochondrial DNA macrohaplogroup L3 basal lineages migrated back to Africa from Asia around 70,000 years ago.
Cabrera VM, Marrero P, Abu-Amero KK, Larruga JM. Cabrera VM, et al. BMC Evol Biol. 2018 Jun 19;18(1):98. doi: 10.1186/s12862-018-1211-4. BMC Evol Biol. 2018. PMID: 29921229 Free PMC article. - Intergenic DNA sequences from the human X chromosome reveal high rates of global gene flow.
Cox MP, Woerner AE, Wall JD, Hammer MF. Cox MP, et al. BMC Genet. 2008 Nov 27;9:76. doi: 10.1186/1471-2156-9-76. BMC Genet. 2008. PMID: 19038041 Free PMC article. - Population structure of Y chromosome SNP haplogroups in the United States and forensic implications for constructing Y chromosome STR databases.
Hammer MF, Chamberlain VF, Kearney VF, Stover D, Zhang G, Karafet T, Walsh B, Redd AJ. Hammer MF, et al. Forensic Sci Int. 2006 Dec 1;164(1):45-55. doi: 10.1016/j.forsciint.2005.11.013. Epub 2005 Dec 5. Forensic Sci Int. 2006. PMID: 16337103 - Genetic evidence for unequal effective population sizes of human females and males.
Wilder JA, Mobasher Z, Hammer MF. Wilder JA, et al. Mol Biol Evol. 2004 Nov;21(11):2047-57. doi: 10.1093/molbev/msh214. Epub 2004 Aug 18. Mol Biol Evol. 2004. PMID: 15317874
Cited by
- Domain duplication, divergence, and loss events in vertebrate Msx paralogs reveal phylogenomically informed disease markers.
Finnerty JR, Mazza ME, Jezewski PA. Finnerty JR, et al. BMC Evol Biol. 2009 Jan 20;9:18. doi: 10.1186/1471-2148-9-18. BMC Evol Biol. 2009. PMID: 19154605 Free PMC article. - Inter-ethnic differences in genetic variants within the transmembrane protease, serine 6 (TMPRSS6) gene associated with iron status indicators: a systematic review with meta-analyses.
Gichohi-Wainaina WN, Towers GW, Swinkels DW, Zimmermann MB, Feskens EJ, Melse-Boonstra A. Gichohi-Wainaina WN, et al. Genes Nutr. 2015 Jan;10(1):442. doi: 10.1007/s12263-014-0442-2. Epub 2014 Nov 22. Genes Nutr. 2015. PMID: 25416640 Free PMC article. - Inferring human population size and separation history from multiple genome sequences.
Schiffels S, Durbin R. Schiffels S, et al. Nat Genet. 2014 Aug;46(8):919-25. doi: 10.1038/ng.3015. Epub 2014 Jun 22. Nat Genet. 2014. PMID: 24952747 Free PMC article. - Parallel adaptive divergence among geographically diverse human populations.
Tennessen JA, Akey JM. Tennessen JA, et al. PLoS Genet. 2011 Jun;7(6):e1002127. doi: 10.1371/journal.pgen.1002127. Epub 2011 Jun 16. PLoS Genet. 2011. PMID: 21698142 Free PMC article. - Demographic history and rare allele sharing among human populations.
Gravel S, Henn BM, Gutenkunst RN, Indap AR, Marth GT, Clark AG, Yu F, Gibbs RA; 1000 Genomes Project; Bustamante CD. Gravel S, et al. Proc Natl Acad Sci U S A. 2011 Jul 19;108(29):11983-8. doi: 10.1073/pnas.1019276108. Epub 2011 Jul 5. Proc Natl Acad Sci U S A. 2011. PMID: 21730125 Free PMC article.
References
- Beerli, P., 2004. Effect of unsampled populations on the estimation of population sizes and migration rates between sampled populations. Mol. Ecol. 13: 827–836. - PubMed
- Cavalli-Sforza, L. L., P. Menozzi and A. Piazza, 1996. The History and Geography of Human Genes. Princeton University Press, Princeton, NJ.
- Charlesworth, B., D. Charlesworth and N. H. Barton, 2003. The effects of genetic and geographic structure on neutral variation. Annu. Rev. Ecol. Syst. 34: 99–125.
Publication types
MeSH terms
Substances
LinkOut - more resources
Full Text Sources


