Positive selection at the protein network periphery: evaluation in terms of structural constraints and cellular context - PubMed (original) (raw)
Positive selection at the protein network periphery: evaluation in terms of structural constraints and cellular context
Philip M Kim et al. Proc Natl Acad Sci U S A. 2007.
Abstract
Because of recent advances in genotyping and sequencing, human genetic variation and adaptive evolution in the primate lineage have become major research foci. Here, we examine the relationship between genetic signatures of adaptive evolution and network topology. We find a striking tendency of proteins that have been under positive selection (as compared with the chimpanzee) to be located at the periphery of the interaction network. Our results are based on the analysis of two types of genome evolution, both in terms of intra- and interspecies variation. First, we looked at single-nucleotide polymorphisms and their fixed variants, single-nucleotide differences in the human genome relative to the chimpanzee. Second, we examine fixed structural variants, specifically large segmental duplications and their polymorphic precursors known as copy number variants. We propose two complementary mechanisms that lead to the observed trends. First, we can rationalize them in terms of constraints imposed by protein structure: We find that positively selected sites are preferentially located on the exposed surface of proteins. Because central network proteins (hubs) are likely to have a larger fraction of their surface involved in interactions, they tend to be constrained and under negative selection. Conversely, we show that the interaction network roughly maps to cellular organization, with the periphery of the network corresponding to the cellular periphery (i.e., extracellular space or cell membrane). This suggests that the observed positive selection at the network periphery may be due to an increase of adaptive events on the cellular periphery responding to changing environments.
Conflict of interest statement
The authors declare no conflict of interest.
Figures
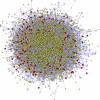
Fig. 1.
The human protein interaction network and its connection to positive selection. Proteins likely to be under positive selection are colored in shades of red (light red, low likelihood of positive selection; dark red, high likelihood) (6). Proteins estimated not to be under positive selection are in yellow, and proteins for which the likelihood of positive selection was not estimated are in white (6).
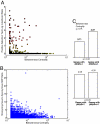
Fig. 2.
Relationship of protein network centrality and single-nucleotide changes. (A) The periphery of the human interactome is strongly enriched for genes under positive selection. Shown is the correlation of the likelihood to be positively selected (6) and betweenness centrality (18). Dots are colored according to the same scheme as in Fig. 1. As expected for a highly significant Spearman rank correlation, almost all dots are near the x axis for high betweenness centralities, whereas high probabilities for positive selection are only observed at low betweenness centralities (Spearman ρ = −0.06, significant at P = 1.2_e_-06). (B) The periphery of the human interaction network is more variable on the protein sequence level. Shown is the ratio of nonsynonymous to synonymous SNPs vs. network centrality. A higher ratio (which corresponds to variability at the protein sequence level) tends to occur at the network periphery (Spearman ρ = −0.1, significant at P = 4.0_e_-04). (C Upper) Betweenness centrality of genes with some likelihood of being under positive selection (with a log-likelihood ratio >0) vs. all other genes. (C Lower) Betweenness centrality of genes with a high ratio of nonsynonymous to synonymous SNPs vs. genes with a low ratio of nonsynonymous to synonymous SNPs. The significance level of the differences is given as the Wilcoxon rank sum P value between the bars.
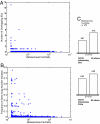
Fig. 3.
Relationship of protein network centrality and changes in genetic copy number. (A) Correlation of the number of overlapping SDs of each gene with the betweenness centrality of the associated protein (Spearman ρ = −0.04, significant at P = 3.3_e_-03). (B) The periphery of the human interaction network is more variable on the level of genome rearrangements. Shown is the frequency of CNVs that intersect a given gene vs. the corresponding protein's network centrality (Spearman ρ = −0.03, significant at P = 0.002). (C Upper) Betweenness centrality of genes that intersect with at least one SD vs. centrality of all other genes. (C Lower) Betweenness centrality of genes that intersect with at least one CNV vs. the centrality of all other genes. The significance level of the differences is given as the Wilcoxon rank sum P value between the bars.
Similar articles
- Relaxed purifying selection and possibly high rate of adaptation in primate lineage-specific genes.
Cai JJ, Petrov DA. Cai JJ, et al. Genome Biol Evol. 2010 Jul 12;2:393-409. doi: 10.1093/gbe/evq019. Genome Biol Evol. 2010. PMID: 20624743 Free PMC article. - The evolution of lineage-specific clusters of single nucleotide substitutions in the human genome.
Xu K, Wang J, Elango N, Yi SV. Xu K, et al. Mol Phylogenet Evol. 2013 Oct;69(1):276-85. doi: 10.1016/j.ympev.2013.06.003. Epub 2013 Jun 14. Mol Phylogenet Evol. 2013. PMID: 23770436 - Uncovering adaptive evolution in the human lineage.
Gayà-Vidal M, Albà MM. Gayà-Vidal M, et al. BMC Genomics. 2014 Jul 16;15(1):599. doi: 10.1186/1471-2164-15-599. BMC Genomics. 2014. PMID: 25030307 Free PMC article. - Understanding the recent evolution of the human genome: insights from human-chimpanzee genome comparisons.
Kehrer-Sawatzki H, Cooper DN. Kehrer-Sawatzki H, et al. Hum Mutat. 2007 Feb;28(2):99-130. doi: 10.1002/humu.20420. Hum Mutat. 2007. PMID: 17024666 Review. - Positive selection in the human genome: from genome scans to biological significance.
Kelley JL, Swanson WJ. Kelley JL, et al. Annu Rev Genomics Hum Genet. 2008;9:143-60. doi: 10.1146/annurev.genom.9.081307.164411. Annu Rev Genomics Hum Genet. 2008. PMID: 18505377 Review.
Cited by
- Positive Selection and Centrality in the Yeast and Fly Protein-Protein Interaction Networks.
Chakraborty S, Alvarez-Ponce D. Chakraborty S, et al. Biomed Res Int. 2016;2016:4658506. doi: 10.1155/2016/4658506. Epub 2016 Mar 28. Biomed Res Int. 2016. PMID: 27119079 Free PMC article. - Lateral genetic transfer: open issues.
Ragan MA, Beiko RG. Ragan MA, et al. Philos Trans R Soc Lond B Biol Sci. 2009 Aug 12;364(1527):2241-51. doi: 10.1098/rstb.2009.0031. Philos Trans R Soc Lond B Biol Sci. 2009. PMID: 19571244 Free PMC article. Review. - What lies beneath? Molecular evolution during the radiation of caecilian amphibians.
Torres-Sánchez M, Gower DJ, Alvarez-Ponce D, Creevey CJ, Wilkinson M, San Mauro D. Torres-Sánchez M, et al. BMC Genomics. 2019 May 9;20(1):354. doi: 10.1186/s12864-019-5694-1. BMC Genomics. 2019. PMID: 31072350 Free PMC article. - Explaining human uniqueness: genome interactions with environment, behaviour and culture.
Varki A, Geschwind DH, Eichler EE. Varki A, et al. Nat Rev Genet. 2008 Oct;9(10):749-63. doi: 10.1038/nrg2428. Nat Rev Genet. 2008. PMID: 18802414 Free PMC article. Review. - Genetic adaptation of the antibacterial human innate immunity network.
Casals F, Sikora M, Laayouni H, Montanucci L, Muntasell A, Lazarus R, Calafell F, Awadalla P, Netea MG, Bertranpetit J. Casals F, et al. BMC Evol Biol. 2011 Jul 11;11:202. doi: 10.1186/1471-2148-11-202. BMC Evol Biol. 2011. PMID: 21745391 Free PMC article.
References
- Chimpanzee Sequencing and Analysis Consortium. Nature. 2005;437:69–87. - PubMed
- Nielsen R. Annu Rev Genet. 2005;39:197–218. - PubMed
- Bamshad M, Wooding SP. Nat Rev Genet. 2003;4:99–111. - PubMed
- Kimura M. Sci Am. 1979;241:98–100. 102, 108. passim. - PubMed
Publication types
MeSH terms
Substances
LinkOut - more resources
Full Text Sources


