Synaptic reorganization in scaled networks of controlled size - PubMed (original) (raw)
Synaptic reorganization in scaled networks of controlled size
Nathan R Wilson et al. J Neurosci. 2007.
Abstract
Neurons in plastic regions of the brain undergo fundamental changes in the number of cells connecting to them as a result of development, plasticity and disease. Across these same time periods, functional changes in cellular and synaptic physiology are known to occur and are often characterized as developmental features of these periods. However, it remains possible that many such changes are direct consequences of the modified degree of partnering, and that neurons intrinsically scale their physiological parameters with network size. To systematically vary a recurrent network's number of neurons while measuring its synaptic properties, we used microfabricated extracellular matrix adhesive islands created with soft lithography to culture neuronal clusters of precise sizes, and assessed their intrinsic connectivity using intracellular recordings and confocal microscopy. Both large and small clusters supported constant densities of excitatory and inhibitory neurons. However, neurons that were provided with more potential partners (larger clusters) formed more connections per cell via an expanded dendritic surface than cocultured smaller clusters. Electrophysiologically, firing rate was preserved across clusters even as size and synapse number increased, due in part to synapses in larger networks having reduced unitary strengths, and sparser paired connectivity. Larger networks also featured a particular increase in the number of excitatory connections onto inhibitory dendrites. We suggest that these specific homeostatic mechanisms, which match the number, strength, and architecture of connections to the number of total available cellular partners in the network, could account for several known phenomena implicated in the formation, organization and degeneration of neuronal circuits.
Figures
Figure 1.
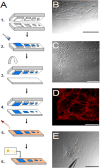
A system for specifying the geometry of cultured neuronal networks. A, Schematic of method for generation of micropatterned cultures. 1, Features of photoresist are carved by ultraviolet light to create a mold, onto which PDMS is poured, cured by heat, cooled, and peeled from the wafer, to form a microstamp. 2, The microstamp is inked with purified hydrophobic alkanethiols and dried with nitrogen gas. 3, The stamp is brought down tightly on a coverslip, which has previously been covered with a thin layer of gold and titanium using an electron-beam evaporator. 4, Consequently, the hydrophobic alkanethiol molecules are transferred onto the regions of the glass surface that contacted the raised regions of the stamp, where they immediately formed self assembled monolayers. A solution of laminin is then applied, the physiosorption of which is specific to the patterned hydrophobic regions. 5, PEG is applied and binds preferentially to the nonpatterned regions, to further repel neurons. 6, Finally, hippocampal neurons are dissected, dissociated and plated onto the laminin coated micropatterned substrates, preferentially attaching to the islands and spreading to assume the island's size and shape. B, Neurons took root and eventually exhibited morphology similar to that observed in normal dissociated cultures. C, Result of micropatterning neurons in a series of crossing lines. D, Corner of a square microisland of neurons labeled with the excitatory neuron marker α-CaMKII. E, Example of how small the islands can be crafted to support neurons. Islands this small were not used in the remaining experiments. Scale bars: B, C, E, 200 μm; D, 500 μm.
Figure 2.
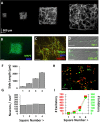
Neuronal islands of systematically varied size exhibit robust functional properties. A, Micropatterned template used in experiments. Neurons labeled with somatic and dendritic marker α-CaMKII and imaged via confocal microscopy at 10×. Manually montaged images made it possible to clearly delineate borders where cells and dendritic networks cannot grow. B, Isolated squares contain neurons identified by DAPI-labeled cell bodies stained for the neuronal marker MAP2. C, Higher-magnification view reveals a heterogeneous mix of DAPI-labeled cells with and without coexpression of MAP2 and synaptic marker VGLUT1, indicating that both neurons and non-neuronal cells are present and synaptic connections have formed between neurons. D, The presence of synaptic connections elucidated with the presynaptic marker synapsin I, which appears as localized puncta along neuronal dendrites. E, Functional activity at synapses verified using the functional dye FM1-43. F, Neuronal island side length showed little deviation across cultures. G, Neuron cell density remained stable across squares of the same chip. H, Immunolabeling with α-CaMKII and GABA to label the full extent of excitatory and inhibitory cell bodies and dendrites. Cell bodies are visualized as bright puncta. I, A similar ratio of excitatory and inhibitory neurons tended to be present across island sizes. Scale bars: B, 500 μm; C, H, 100 μm; D, 10 μm; E, 20 μm. Error bars indicate SEM.
Figure 3.
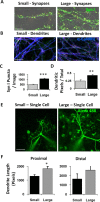
Scaling network size changes structural synaptic capacity. A, Immunostaining for synapsin I to count the number of presynaptic terminals. B, Immunostaining for α-CaMKII to quantify the percentage of area occupied by excitatory dendritic branches. C, Synapse density was significantly increased on the larger island, despite a constant neuron density between large and small islands (Fig. 2_G_). D, Branch density was significantly increased on the larger island, despite a constant neuron density between large and small islands (Fig. 2_G_), indicating that neurons in the larger networks interact via larger dendritic trees. E, Live imaging 15 min after filling neurons with the fluorescent dye Alexa 488. F, Dendritic area in single neurons was increased on the larger island, particularly in terms of the length of proximal branches. Scale bars: A, 10 μm; B, 20 μm; E, 50 μm. *p < 0.05; **p < 0.01; ***p < 0.001. Error bars indicate SEM.
Figure 4.
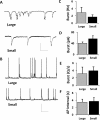
Implications of increased connectivity for functional activity. A, Excitatory synaptic bursting activity recorded intracellularly in voltage clamp for neurons in large islands (top traces) and small islands (bottom traces). Xs indicate the locations of transient spiking events that are omitted from traces to conserve space. B, Action potentials recorded intracellularly in current clamp for neurons in large islands (top traces) and small islands (bottom traces). C, Measuring the frequency of excitatory synaptic bursts revealed a slight but nonsignificant decrease in burst frequency in clusters comprising fewer neurons. D, Measuring the amplitude of excitatory synaptic bursts revealed a slight but nonsignificant increase in peak amplitude for clusters comprising fewer neurons. E, Measuring the summed excitatory depolarization per unit time reveals no change in the total excitatory input to neurons situated in clusters of varying size. F, Neurons across a variety of micropatterned islands also exhibit comparable functional activity in terms of action potential frequency. Calibration: A, 80 pA, 400 ms; B, 100 mV, 4 s. Error bars indicate SEM.
Figure 5.
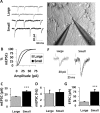
Scaling network size changes unitary strength per synapse and the functional coupling between pairs of neurons. A, mEPSCs were recorded postsynaptically via whole-cell patch clamp in the presence of TTX in either a large or small network. Calibration: 20 pA, 64 ms. B, Cumulative density functions depicting distributions of mEPSC amplitudes recorded from large and small networks. A rightward shift is observed in mEPSC amplitudes recorded from small networks. C, Average mEPSC amplitudes for neurons recorded in each size network show an increase in mean event amplitude in small networks relative to larger ones. D, Average mEPSC frequency for neurons recorded in each size network. mEPSC frequency was not significantly different in the two types of networks, despite a reduced number of synapses in the small network (Fig. 3_C_). E, The extent to which pairs of neurons were functionally coupled was assessed via evoked synaptic transmission using dual intracellular patch clamp. Action potentials were elicited in one “presynaptic” neuron whereas the synaptic response was measured in voltage clamp in the second “postsynaptic” neuron. F, Typical evoked transmission (stimulus artifacts replaced with arrows) in small networks was significantly increased in amplitude compared with evoked transmission in large networks. G, Quantification for all evoked transmission in large and small networks. Evoked responses in small networks were significantly larger than evoked responses in large networks. Note that pairs where evoked transmission in one neuron triggered an action potential in the postsynaptic neuron were omitted, because such depolarizations were too large to quantify in voltage clamp with our patch circuits. Although presynaptically induced spiking was rare in large networks, it was relatively common in small networks. ***p < 0.001. Error bars indicate SEM.
Figure 6.
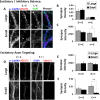
Scaling network size changes functional network architecture and excitatory–inhibitory balance. A, Triple immunostaining for the excitatory dendrite marker α-CaMKII, the excitatory synapse marker VGLUT1, and the inhibitory synapse marker VGAT. B, Density of excitatory and inhibitory synapses per unit length of excitatory dendrite. There was no significant difference in the relative density of excitatory and inhibitory synapses between large and small networks. C, The punctal intensity of excitatory and inhibitory synaptic boutons, as measured by IOD, showed no change in the intensity of excitatory synapses from large to small networks. However, the intensity of inhibitory synapses in small networks was significantly decreased compared with those in large networks. D, Triple immunostaining for the excitatory dendrite marker α-CaMKII, the inhibitory dendrite marker GABA, and the excitatory synapse marker VGLUT1. E, Staining intensity of excitatory synaptic boutons on either excitatory or inhibitory dendrites. No significant difference was detected in excitatory intensity onto either type of postsynaptic cell between large or small networks. F, Density of excitatory synapses made onto either an excitatory or inhibitory dendrite in large or small networks. A significant reduction of excitatory synapses onto inhibitory dendrites is observed in small networks. Scale bars: A, 10 μm; D, 20 μm. *p < 0.05; **p < 0.01. Error bars indicate SEM.
Similar articles
- Diminished neuronal activity increases neuron-neuron connectivity underlying silent synapse formation and the rapid conversion of silent to functional synapses.
Nakayama K, Kiyosue K, Taguchi T. Nakayama K, et al. J Neurosci. 2005 Apr 20;25(16):4040-51. doi: 10.1523/JNEUROSCI.4115-04.2005. J Neurosci. 2005. PMID: 15843606 Free PMC article. - Synaptic connectivity in cultured hypothalamic neuronal networks.
Müller TH, Swandulla D, Zeilhofer HU. Müller TH, et al. J Neurophysiol. 1997 Jun;77(6):3218-25. doi: 10.1152/jn.1997.77.6.3218. J Neurophysiol. 1997. PMID: 9212269 - Synchronization in hybrid neuronal networks of the hippocampal formation.
Netoff TI, Banks MI, Dorval AD, Acker CD, Haas JS, Kopell N, White JA. Netoff TI, et al. J Neurophysiol. 2005 Mar;93(3):1197-208. doi: 10.1152/jn.00982.2004. Epub 2004 Nov 3. J Neurophysiol. 2005. PMID: 15525802 - Role of giant depolarizing potentials in shaping synaptic currents in the developing hippocampus.
Mohajerani MH, Cherubini E. Mohajerani MH, et al. Crit Rev Neurobiol. 2006;18(1-2):13-23. doi: 10.1615/critrevneurobiol.v18.i1-2.30. Crit Rev Neurobiol. 2006. PMID: 17725505 Review. - Neural networks and synaptic transmission in immature hippocampus.
Swann JW, Smith KL, Brady RJ. Swann JW, et al. Adv Exp Med Biol. 1990;268:161-71. doi: 10.1007/978-1-4684-5769-8_19. Adv Exp Med Biol. 1990. PMID: 1963739 Review.
Cited by
- Neural Circuits on a Chip.
Hasan MF, Berdichevsky Y. Hasan MF, et al. Micromachines (Basel). 2016 Sep 5;7(9):157. doi: 10.3390/mi7090157. Micromachines (Basel). 2016. PMID: 30404330 Free PMC article. Review. - Self-organization of modular network architecture by activity-dependent neuronal migration and outgrowth.
Okujeni S, Egert U. Okujeni S, et al. Elife. 2019 Sep 17;8:e47996. doi: 10.7554/eLife.47996. Elife. 2019. PMID: 31526478 Free PMC article. - Mechanical control of tissue and organ development.
Mammoto T, Ingber DE. Mammoto T, et al. Development. 2010 May;137(9):1407-20. doi: 10.1242/dev.024166. Development. 2010. PMID: 20388652 Free PMC article. Review. - Engineered neuronal circuits: a new platform for studying the role of modular topology.
Shein-Idelson M, Ben-Jacob E, Hanein Y. Shein-Idelson M, et al. Front Neuroeng. 2011 Sep 27;4:10. doi: 10.3389/fneng.2011.00010. eCollection 2011. Front Neuroeng. 2011. PMID: 21991254 Free PMC article. - Scalability of Asynchronous Networks Is Limited by One-to-One Mapping between Effective Connectivity and Correlations.
van Albada SJ, Helias M, Diesmann M. van Albada SJ, et al. PLoS Comput Biol. 2015 Sep 1;11(9):e1004490. doi: 10.1371/journal.pcbi.1004490. eCollection 2015 Sep. PLoS Comput Biol. 2015. PMID: 26325661 Free PMC article.
References
- Barnes CA, Rao G, Foster TC, McNaughton BL. Region-specific age effects on AMPA sensitivity: electrophysiological evidence for loss of synaptic contacts in hippocampal field CA1. Hippocampus. 1992;2:457–468. - PubMed
- Betz WJ, Bewick GS. Optical analysis of synaptic vesicle recycling at the frog neuromuscular junction. Science. 1992;255:200–203. - PubMed
- Burrone J, Murthy VN. Synaptic gain control and homeostasis. Curr Opin Neurobiol. 2003;13:560–567. - PubMed
Publication types
MeSH terms
Substances
LinkOut - more resources
Full Text Sources
Other Literature Sources
