Genome organization and gene expression shape the transposable element distribution in the Drosophila melanogaster euchromatin - PubMed (original) (raw)
Genome organization and gene expression shape the transposable element distribution in the Drosophila melanogaster euchromatin
Pierre Fontanillas et al. PLoS Genet. 2007 Nov.
Abstract
The distribution of transposable elements (TEs) in a genome reflects a balance between insertion rate and selection against new insertions. Understanding the distribution of TEs therefore provides insights into the forces shaping the organization of genomes. Past research has shown that TEs tend to accumulate in genomic regions with low gene density and low recombination rate. However, little is known about the factors modulating insertion rates across the genome and their evolutionary significance. One candidate factor is gene expression, which has been suggested to increase local insertion rate by rendering DNA more accessible. We test this hypothesis by comparing the TE density around germline- and soma-expressed genes in the euchromatin of Drosophila melanogaster. Because only insertions that occur in the germline are transmitted to the next generation, we predicted a higher density of TEs around germline-expressed genes than soma-expressed genes. We show that the rate of TE insertions is greater near germline- than soma-expressed genes. However, this effect is partly offset by stronger selection for genome compactness (against excess noncoding DNA) on germline-expressed genes. We also demonstrate that the local genome organization in clusters of coexpressed genes plays a fundamental role in the genomic distribution of TEs. Our analysis shows that-in addition to recombination rate-the distribution of TEs is shaped by the interaction of gene expression and genome organization. The important role of selection for compactness sheds a new light on the role of TEs in genome evolution. Instead of making genomes grow passively, TEs are controlled by the forces shaping genome compactness, most likely linked to the efficiency of gene expression or its complexity and possibly their interaction with mechanisms of TE silencing.
Conflict of interest statement
Competing interests. The authors have declared that no competing interests exist.
Figures
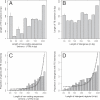
Figure 1. TE Insertions and Selection for Genome Compactness
(A,B) The correlation between the length of noncoding sequences and the length of TE insertions for genes and intergenic regions. To avoid interaction or facilitation effects in the case of multiple insertions, only unique insertions (by gene or intergenic region) were incorporated in this analysis. (C,D) The nonlinear relationship between the length of noncoding sequences and the proportion of genes or intergenic regions with TE insertion(s). The lines represent the linear model (estimate and standard error) for this correlation (quasibinomial GLM on presence/absence of insertion[s] in genes and intergenic regions).
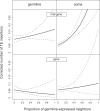
Figure 2. Number of TE Insertions in Intergenic Regions and Genes as a Function of the Proportion of Germline-Expressed Neighbors
The figure represents the coefficients (±95% confidence intervals) from the GLM analysis presented in Table 1. The number of TE insertions per gene and intergenic region shown on the _y_-axis is corrected for the effect of four covariables entered in the GLM (cf., Table 1): recombination rate, intergenic region or intron + UTR length, proportion of conserved elements, and chromosome (X versus autosomes).
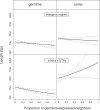
Figure 3. Length of Intergenic Regions and Introns + UTRs as a Function of the Proportion of Germline-Expressed Neighbors
The figure represents the coefficients (±95% confidence intervals) of a log-gaussian GLM analysis of noncoding length of genes/length of intergenic regions as a function of the factors tissue of expression (germline versus soma), element (gene versus intergenic), and neighborhood (proportion of germline-expressed genes among the ten neighbors). The figure illustrates that the effect of the genomic neighborhood depends both on the identity of the genomic element (gene versus intergenic region) as well as the expression type, a fact reflected in the significant triple interaction term in the GLM (F = 4.19, p < 0.05).
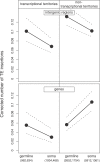
Figure 4. Number of TE Insertions for Genes and Intergenic Regions in Transcriptional and Nontranscriptional Territories
This figure is a representation of a GLM analysis including recombination, noncoding length, proportion of conserved sequences, chromosome (X versus autosomes), territory (transcriptional territories versus nontranscriptional territories), tissue of expression (germline versus soma), and element (gene versus intergenic regions) (see Table S6). The triple interaction among the last three factors is significant (F = 8.8, p < 0.01). The figure shows the coefficients and their 95% confidence intervals and the number of intergenic regions and genes, respectively.
Figure 5. Schematic Representation of TE Dynamics in the Euchromatin of D. melanogaster
This figure illustrates the distribution of TEs in and between germline-expressed and soma-expressed genes (in white and black, respectively) within and outside transcriptional territories.
Similar articles
- Paucity of chimeric gene-transposable element transcripts in the Drosophila melanogaster genome.
Lipatov M, Lenkov K, Petrov DA, Bergman CM. Lipatov M, et al. BMC Biol. 2005 Nov 12;3:24. doi: 10.1186/1741-7007-3-24. BMC Biol. 2005. PMID: 16283942 Free PMC article. - Species-specific chromatin landscape determines how transposable elements shape genome evolution.
Huang Y, Shukla H, Lee YCG. Huang Y, et al. Elife. 2022 Aug 23;11:e81567. doi: 10.7554/eLife.81567. Elife. 2022. PMID: 35997258 Free PMC article. - On the abundance and distribution of transposable elements in the genome of Drosophila melanogaster.
Bartolomé C, Maside X, Charlesworth B. Bartolomé C, et al. Mol Biol Evol. 2002 Jun;19(6):926-37. doi: 10.1093/oxfordjournals.molbev.a004150. Mol Biol Evol. 2002. PMID: 12032249 - Interactions between transposable elements and Argonautes have (probably) been shaping the Drosophila genome throughout evolution.
Siomi H, Siomi MC. Siomi H, et al. Curr Opin Genet Dev. 2008 Apr;18(2):181-7. doi: 10.1016/j.gde.2008.01.002. Epub 2008 Mar 4. Curr Opin Genet Dev. 2008. PMID: 18313288 Review. - Transposable elements in natural populations of Drosophila melanogaster.
Lee YC, Langley CH. Lee YC, et al. Philos Trans R Soc Lond B Biol Sci. 2010 Apr 27;365(1544):1219-28. doi: 10.1098/rstb.2009.0318. Philos Trans R Soc Lond B Biol Sci. 2010. PMID: 20308097 Free PMC article. Review.
Cited by
- Gene properties and chromatin state influence the accumulation of transposable elements in genes.
Zhang Y, Mager DL. Zhang Y, et al. PLoS One. 2012;7(1):e30158. doi: 10.1371/journal.pone.0030158. Epub 2012 Jan 17. PLoS One. 2012. PMID: 22272293 Free PMC article. - Comparison of class 2 transposable elements at superfamily resolution reveals conserved and distinct features in cereal grass genomes.
Han Y, Qin S, Wessler SR. Han Y, et al. BMC Genomics. 2013 Jan 31;14:71. doi: 10.1186/1471-2164-14-71. BMC Genomics. 2013. PMID: 23369001 Free PMC article. - Expression of Drosophila virilis retroelements and role of small RNAs in their intrastrain transposition.
Rozhkov NV, Zelentsova ES, Shostak NG, Evgen'ev MB. Rozhkov NV, et al. PLoS One. 2011;6(7):e21883. doi: 10.1371/journal.pone.0021883. Epub 2011 Jul 11. PLoS One. 2011. PMID: 21779346 Free PMC article. - Gene duplication and the genome distribution of sex-biased genes.
Gallach M, Domingues S, Betrán E. Gallach M, et al. Int J Evol Biol. 2011;2011:989438. doi: 10.4061/2011/989438. Epub 2011 Sep 5. Int J Evol Biol. 2011. PMID: 21904687 Free PMC article. - _Cis_- and _Trans_-regulatory Effects on Gene Expression in a Natural Population of Drosophila melanogaster.
Osada N, Miyagi R, Takahashi A. Osada N, et al. Genetics. 2017 Aug;206(4):2139-2148. doi: 10.1534/genetics.117.201459. Epub 2017 Jun 14. Genetics. 2017. PMID: 28615283 Free PMC article.
References
- Biemont C, Vieira C. Genetics—Junk DNA as an evolutionary force. Nature. 2006;443:521–524. - PubMed
- Bejerano G, Lowe CB, Ahituv N, King B, Siepel A, et al. A distal enhancer and an ultraconserved exon are derived from a novel retroposon. Nature. 2006;441:87–90. - PubMed
- Lerman DN, Michalak P, Helin AB, Bettencourt BR, Feder ME. Modification of heat-shock gene expression in Drosophila melanogaster populations via transposable elements. Mol Biol Evol. 2003;20:135–144. - PubMed
Publication types
MeSH terms
Substances
LinkOut - more resources
Full Text Sources
Molecular Biology Databases
Miscellaneous


