Human Pcf11 enhances degradation of RNA polymerase II-associated nascent RNA and transcriptional termination - PubMed (original) (raw)
Human Pcf11 enhances degradation of RNA polymerase II-associated nascent RNA and transcriptional termination
Steven West et al. Nucleic Acids Res. 2008 Feb.
Abstract
The poly(A) (pA) signal possesses a dual function in 3' end processing of pre-mRNA and in transcriptional termination of RNA polymerase II (Pol II) for most eukaryotic protein-coding genes. A key protein factor in yeast and Drosophila Pol II transcriptional termination is the 3'-end processing factor, Pcf11. In vitro studies suggest that Pcf11 is capable of promoting the dissociation of Pol II elongation complexes from DNA. Moreover, several mutant alleles of yeast Pcf11 effect termination in vivo. However, functions of human Pcf11 (hPcf11) in Pol II termination have not been explored. Here we show that depletion of hPcf11 from HeLa cells reduces termination efficiency. Furthermore, we provide evidence that hPcf11 is required for the efficient degradation of the 3' product of pA site cleavage. Finally, we show that these functions of hPcf11 require an intact pA signal.
Figures
Figure 1.
hPcf11 depletion and its effect on 3′ end processing. (A) Analysis of the efficiency of hPcf11 RNAi treatment. Panel 1; hPcf11 mRNA in mock cells or hPcf11-depleted cells (kd). Panel 2; drosha mRNA. Panel 3; hPcf11 protein. Panel 4; actin protein. (B) S1 analysis of β-globin mRNA levels in mock- and hPcf11-depleted cells (kd). The diagram shows the pMAZ4 plasmid, depicting β-globin exons (white boxes), pA signal (pA), MAZ4 termination element (hatched box) and S1 probe (shown above plasmid). Bands for the VA transfection control (VA) and β-globin mRNA (βpA) are indicated with arrows. Undigested probe is indicated with an asterisk. Lanes 3 and 4 show the β-globin and VA probes in the presence (P+) and absence (P–) of S1 nuclease, respectively. Note, that the P– lane only contains 20% of the probe used in the analysis to prevent it appearing overexposed on the gel. Quantitation measures the percentage of β-globin mRNA in kd cells as compared to mock cells (value fixed at 100%). Quantitation of a real-time RT-PCR experiment used to detect β-globin mRNA is also shown. (C) Real-time RT-PCR analysis of β-globin pre-mRNA, not cleaved at the pA site, in mock-treated and hPcf11-depleted cells (kd). The diagram shows primers used for reverse transcription (dpA) and for PCR (upA/pAr). Graph shows fold change in the abundance of this species. The value obtained in mock-treated cells is set to 1.
Figure 2.
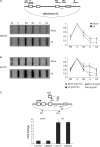
hPcf11 is required for efficient Pol II transcriptional termination. (A) Top diagram: plasmid used for NRO. HIV promoter (arrow), exons (white boxes), pA signal (pA) and MAZ4/CoTC termination element (hatched box) are shown. Data panel: NRO analysis of transcriptional termination on pMAZ4 in mock-treated and hPcf11-depleted (kd) cells. NRO probes are indicated above each slot and their positions are shown in the diagram. M is an empty M13 vector and controls for background hybridization. Quantitation is shown in the accompanying graphs. All probes values are relative to the B3 signal (set at 1). (B) NRO analysis of pCoTC in mock-treated and hPcf11-depleted (kd) HeLa cells. Probes are indicated above each slot and positions are as in A. The graph shows quantitation of the experiment and of a NRO that was performed on mock-treated and hPcf11kd cells transfected with pΔpA, which has a mutated pA signal and does not support termination. (C) Real-time RT-PCR analysis of transcriptional read-through on the pCoTC and pMAZ4 constructs in mock-treated and hPcf11-depleted (kd) cells. Primers for reverse transcription (oligo-dT and RT) and PCR (pAr/upA and RTr/RTf) are shown on the accompanying diagrams. Quantitation was determined by dividing the RTr/RTf signal by the pAr/upA signal. The value obtained in mock-treated cells was set to 1.
Figure 3.
hPcf11 is required to degrade the 3′ product of pA site/RZ cleavage. (A) Hybrid selection technique. β-globin RNA that is continuous with exon 3 (white box) is selected by the biotinylated probe (shown above exon 3) and bound by the streptavidin-coated magnetic beads. The 3′ product of pA site cleavage (bottom species) remains unbound. (B) RT-PCR analysis of pMAZ4 RNA from before hybrid selection (lane 1: total) and from the unbound RNA fraction obtained after selection (lane 2: unbound). Primers used for reverse transcription (dpA) and PCR (upA/dpA) are shown in the diagram. (C) Real-time RT-PCR analysis of the 3′ pA site cleavage product (obtained from the unbound fraction of selected RNA) in mock-treated or hPcf11-depleted (kd) cells transfected with pMAZ4 and VA. The β-globin primers used for cDNA synthesis (Vr) and PCR (Rzf and Vr) are indicated in the diagram. Quantitiation is normalized to the VA signal. The mock sample is given a value of 1. (D) Top data panel: NRO analysis of pΔterm. Probes are the same as in Figure 2A. Lower data panel: real-time RT-PCR analysis of the 3′ pA site cleavage product in mock-treated or hPcf11-depleted (kd) cells transfected with pΔterm. Primers used for cDNA synthesis (Vr) and PCR (Rzf and Vr) are shown in the diagram. Quantitiation is normalized to the VA signal. The mock sample is given a value of 1.
Figure 4.
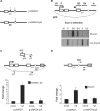
hPcf11 function requires a functional pA signal. (A) Diagram of przMAZ4 and przMAZ4ΔpA. Final exon (white box), pA site (pA), RZ (white circle) and MAZ4 element (hatched box) are shown. pA site mutation is denoted by an X. Arrows represent sites of transcript cleavage. (B) hsNRO analysis of pRZ (shown in diagram). Transcripts were selected with the B3 probe (shown in the diagram above the final exon). Top panel shows selected transcripts (bound) and the bottom panel shows unselected transcripts (un-bound). NRO probes are shown in the diagram. (C) Real-time RT-PCR analysis of transcriptional termination on przMAZ4 or przMAZ4ΔpA in mock-treated or hPcf11-depleted (kd) cells. The plasmid is przMAZ4, where the RZ is shown by a white circle. The primers used for reverse transcription (RT) and PCR (RTf/RTr) are shown. The top diagram depicts the 3′ end of the mRNA (from the final exon to the poly(A) tail). Primers used for reverse transcription (oligo-dT) and PCR (upA/pAr) are indicated. Read-through was calculated as a ratio of the two PCR products and set at 1 in mock-treated cells. (D) Real-time RT-PCR analysis of the 3′ RZ cleavage product in mock-treated and hPcf11-depleted (kd) cells. Primers used for cDNA synthesis (Vr) and subsequent PCR (Rzf/Vr) are shown in the diagram. The RZ is again depicted by a white circle. Graph shows fold change where the value for mock-treated cells is given a value of 1.
Figure 5.
Model. Model 1: after transcription of the pA signal (pA), hPcf11 (white circle) and Xrn2 (black pack-man) are co-recruited to Pol II. Following cleavage at the pA site/RZ/CoTC (shown by grey lightening), Xrn2 degrades Pol II-associated RNA and, together with hPcf11 and a termination element (hatched box) promotes Pol II release. Model 2: hPcf11 is recruited to Pol II upon transcription of the pA signal. However, a further hPcf11 is recruited to the cleaved RNA transcript by Xrn2. Again, degradation of the Pol II-associated transcript, enhanced by hPcf11 function, promotes Pol II release at the termination element.
Similar articles
- CTD-dependent dismantling of the RNA polymerase II elongation complex by the pre-mRNA 3'-end processing factor, Pcf11.
Zhang Z, Fu J, Gilmour DS. Zhang Z, et al. Genes Dev. 2005 Jul 1;19(13):1572-80. doi: 10.1101/gad.1296305. Genes Dev. 2005. PMID: 15998810 Free PMC article. - Selective Roles of Vertebrate PCF11 in Premature and Full-Length Transcript Termination.
Kamieniarz-Gdula K, Gdula MR, Panser K, Nojima T, Monks J, Wiśniewski JR, Riepsaame J, Brockdorff N, Pauli A, Proudfoot NJ. Kamieniarz-Gdula K, et al. Mol Cell. 2019 Apr 4;74(1):158-172.e9. doi: 10.1016/j.molcel.2019.01.027. Epub 2019 Feb 25. Mol Cell. 2019. PMID: 30819644 Free PMC article. - Functional interaction of yeast pre-mRNA 3' end processing factors with RNA polymerase II.
Licatalosi DD, Geiger G, Minet M, Schroeder S, Cilli K, McNeil JB, Bentley DL. Licatalosi DD, et al. Mol Cell. 2002 May;9(5):1101-11. doi: 10.1016/s1097-2765(02)00518-x. Mol Cell. 2002. PMID: 12049745 - On the importance of being co-transcriptional.
Neugebauer KM. Neugebauer KM. J Cell Sci. 2002 Oct 15;115(Pt 20):3865-71. doi: 10.1242/jcs.00073. J Cell Sci. 2002. PMID: 12244124 Review. - Protein factors in pre-mRNA 3'-end processing.
Mandel CR, Bai Y, Tong L. Mandel CR, et al. Cell Mol Life Sci. 2008 Apr;65(7-8):1099-122. doi: 10.1007/s00018-007-7474-3. Cell Mol Life Sci. 2008. PMID: 18158581 Free PMC article. Review.
Cited by
- Community structure analysis of transcriptional networks reveals distinct molecular pathways for early- and late-onset temporal lobe epilepsy with childhood febrile seizures.
Moreira-Filho CA, Bando SY, Bertonha FB, Iamashita P, Silva FN, Costa Lda F, Silva AV, Castro LH, Wen HT. Moreira-Filho CA, et al. PLoS One. 2015 May 26;10(5):e0128174. doi: 10.1371/journal.pone.0128174. eCollection 2015. PLoS One. 2015. PMID: 26011637 Free PMC article. - Ratio-based analysis of differential mRNA processing and expression of a polyadenylation factor mutant pcfs4 using arabidopsis tiling microarray.
Zheng J, Xing D, Wu X, Shen Y, Kroll DM, Ji G, Li QQ. Zheng J, et al. PLoS One. 2011 Feb 25;6(2):e14719. doi: 10.1371/journal.pone.0014719. PLoS One. 2011. PMID: 21364912 Free PMC article. - Casein Kinase 1δ Stabilizes Mature Axons by Inhibiting Transcription Termination of Ankyrin.
LaBella ML, Hujber EJ, Moore KA, Rawson RL, Merrill SA, Allaire PD, Ailion M, Hollien J, Bastiani MJ, Jorgensen EM. LaBella ML, et al. Dev Cell. 2020 Jan 6;52(1):88-103.e18. doi: 10.1016/j.devcel.2019.12.005. Dev Cell. 2020. PMID: 31910362 Free PMC article. - Identification of a plant-specific Zn2+-sensitive ribonuclease activity.
Xing D, Ni S, Kennedy MA, Li QQ. Xing D, et al. Planta. 2009 Sep;230(4):819-25. doi: 10.1007/s00425-009-0986-3. Epub 2009 Jul 28. Planta. 2009. PMID: 19636588 - Human snRNA genes use polyadenylation factors to promote efficient transcription termination.
O'Reilly D, Kuznetsova OV, Laitem C, Zaborowska J, Dienstbier M, Murphy S. O'Reilly D, et al. Nucleic Acids Res. 2014 Jan;42(1):264-75. doi: 10.1093/nar/gkt892. Epub 2013 Oct 4. Nucleic Acids Res. 2014. PMID: 24097444 Free PMC article.
References
- Proudfoot NJ, Furger A, Dye MJ. Integrating mRNA processing with transcription. Cell. 2002;108:501–512. - PubMed
- Proudfoot NJ. How RNA polymerase II terminates transcription in higher eukaryotes. Trends Biochem. Sci. 1989;14:105–110. - PubMed
- Connelly S, Manley JL. A functional mRNA polyadenylation signal is required for transcription termination by RNA polymerase II. Genes Dev. 1988;2:440–452. - PubMed
- Rosonina E, Kaneko S, Manley JL. Terminating the transcript: breaking up is hard to do. Genes Dev. 2006;20:1050–1056. - PubMed
Publication types
MeSH terms
Substances
LinkOut - more resources
Full Text Sources
Molecular Biology Databases


