The inhibitory HVEM-BTLA pathway counter regulates lymphotoxin receptor signaling to achieve homeostasis of dendritic cells - PubMed (original) (raw)
. 2008 Jan 1;180(1):238-48.
doi: 10.4049/jimmunol.180.1.238.
Kirsten Schneider, Karen Potter, Nathalie Droin, James Fulton, Paula S Norris, Suk-won Ha, Yang-Xin Fu, Theresa Murphy, Kenneth M Murphy, Klaus Pfeffer, Chris A Benedict, Carl F Ware
Affiliations
- PMID: 18097025
- PMCID: PMC2711003
- DOI: 10.4049/jimmunol.180.1.238
The inhibitory HVEM-BTLA pathway counter regulates lymphotoxin receptor signaling to achieve homeostasis of dendritic cells
Carl De Trez et al. J Immunol. 2008.
Abstract
Proliferation of dendritic cells (DC) in the spleen is regulated by positive growth signals through the lymphotoxin (LT)-beta receptor; however, the countering inhibitory signals that achieve homeostatic control are unresolved. Mice deficient in LTalpha, LTbeta, LTbetaR, and the NFkappaB inducing kinase show a specific loss of CD8- DC subsets. In contrast, the CD8alpha- DC subsets were overpopulated in mice deficient in the herpesvirus entry mediator (HVEM) or B and T lymphocyte attenuator (BTLA). HVEM- and BTLA-deficient DC subsets displayed a specific growth advantage in repopulating the spleen in competitive replacement bone marrow chimeric mice. Expression of HVEM and BTLA were required in DC and in the surrounding microenvironment, although DC expression of LTbetaR was necessary to maintain homeostasis. Moreover, enforced activation of the LTbetaR with an agonist Ab drove expansion of CD8alpha- DC subsets, overriding regulation by the HVEM-BTLA pathway. These results indicate the HVEM-BTLA pathway provides an inhibitory checkpoint for DC homeostasis in lymphoid tissue. Together, the LTbetaR and HVEM-BTLA pathways form an integrated signaling network regulating DC homeostasis.
Conflict of interest statement
Disclosures
The authors have no financial conflict of interest.
Figures
FIGURE 1
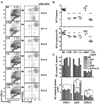
LTαβ-LTβR interaction mediates homeostasis of CD8− DC subsets. A, CD11chigh cells in the spleen were analyzed for CD4 and CD8α expression in wt B6, LTβR-, LTβ-, LTα-, LIGHT- and LTβ/LIGHT-deficient mice by flow cytometry as described in Materials and Methods. A representative histogram is shown for each mouse strain. The ratio of CD8α to CD4 DC subsets was calculated from values in the upper left and lower right quadrants. B, The percentage of DC are presented as a fraction of total nucleated splenocytes (top panel) and the total number of DC (bottom panel) in the spleen from the indicated gene deficient mice. Each data point represents an individual animal and the data are pooled from two analyses. C. The percentage (top panel) and total number (bottom panel) of individual CD4+, CD8α, and CD8α−/CD4− DC subsets within the gated CD11chigh DC. The bars are the mean ± SD from at least three mice per group and the data are representative of three independent experiments. In all panels, Student t test evaluation of significance where *, **, and *** denote p < 0.05, p < 0.01, and p < 0.001, respectively, between the indicated groups.
FIGURE 2
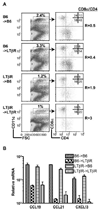
Homeostasis of splenic DC subsets is independent of the lymphoid tissue organizing chemokines. A, Eight weeks after bone marrow reconstitution, splenocytes within the CD11chigh population (gates indicated in figure) were analyzed for expression of CD4 and CD8α. A representative histogram is shown for each group of chimeras and is representative of two independent experiments. The ratio of CD8α to CD4 DC subsets was calculated from values in the upper left and lower right quadrants. B, Quantitative PCR analysis of chemokine mRNA expressed in the spleen from the bone marrow chimeras is presented as the relative amount of indicated mRNA normalized to 18S. Error bars are the mean±SD from at least two mice per group and the data are representative of two independent experiments.
FIGURE 3
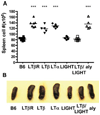
Counter regulatory effects of LIGHT and LTαβ-LTβR on splenic size and cellularity. A, The total number of spleen cells were determined in wt B6, LTβR, LTβ-, LTα-, LIGHT-, LTβ/LIGHT-deficient and aly mice. Each point represents the value obtained from an individual animal and the data are from five pooled experiments. B, Representative spleens from mice deficient in LTβR, LTβ, LTα, LIGHT, and LTβ/LIGHT, or mutant aly and wt B6 mice. Student t test significance between the wt B6 and the other groups p < 0.001 (*).
FIGURE 4
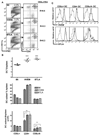
HVEM and BTLA counter regulate homeostasis of CD4+ and CD4− CD8α− DC subsets. A, CD11chigh cells gated as indicated were analyzed for CD4 and CD8α expression in wt B6, HVEM- or BTLA-deficient mice. A representative histogram is shown for each mouse strain. The ratio of CD8α to CD4 DC subsets was calculated from values in the upper left and lower right quadrants. B, The percentage of DC as a fraction of total nucleated splenocytes (top panel), the percentage of individual DC subsets (middle panel) and the total number cells in each DC subset (bottom panel) in the spleen from the indicated gene-deficient mice. Each data point represents the value obtained from an individual animal and the data are pooled from two analyses. Bars show the mean ± SD from at least n = three mice per group and the data are representative of three independent experiments. Student’s t test was performed where *, **, and *** denote significance of p < 0.05, p < 0.01, and p < 0.001, respectively, between the indicated groups. C, Flow cytometric analysis of HVEM and BTLA expression by CD8α+, and CD4+ CD8− DC subsets within gated DC from WT (solid line) and HVEM-deficient mice (dashed line) and WT mice (BTLA staining = solid line and ctrl staining = dashed line), respectively.
FIGURE 5
LIGHT/LTβ/HVEM mice reveal an LT-independent DC subset with normal CD8α/CD4 subset ratio. A. CD11chigh cells gated as indicated were analyzed for CD4 and CD8α expression in WT B6, LTβ/LIGHT, and LTβ/LIGHT/HVEM-deficient mice as described in the Materials and Methods. A representative histogram is shown for each mouse strain. The ratio of CD8α to CD4 DC subsets was calculated from values in the upper left and lower right quadrants. B, The percentage of DC as a fraction of total nucleated splenocytes (top panel), the percentage of individual DC subsets (middle panel) and the total number cells in each DC subset (bottom panel) in the spleen from the indicated gene deficient mice were calculated from flow data. Each data point represents the value obtained from an individual animal and the data are pooled from two analyses. Bars show the mean ± SD from at least three mice per group, and the data are representative of three independent experiments. Student’s t test was performed where *, **, and *** denote significance of p < 0.05, p < 0.01, and p < 0.001, respectively, between the indicated groups.
FIGURE 6
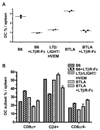
DC subsets in LTβR-Fc-treated BTLA−/− mice. A. The percentage of DC in LIGHT/LTβ/HVEM- and BTLA-deficient as well as wt B6 and LTβR-Fc-treated B6 mice are presented as the percentage of total nucleated splenocytes. Mice were treated with the mouse LTβR-Fc fusion protein as described in the methods. B, The percentage of individual CD4+, CD8α, and CD8α/CD4− DC subsets within the gated CD11chigh DC. Each data point represents the value obtained from an individual animal. Bars show the mean ± SD from at least n = 2 mice per group and the data are representative of two independent experiments.
FIGURE 7
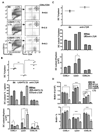
Activation of LTβR signaling restores DC homeostasis. A, CD11chigh cells gated as indicated were analyzed for CD4 and CD8α expression in wt B6, LIGHT/LTβ-deficient mice (untreated), and LTβ/LIGHT treated with rat anti-mouse LTβR mAb as described in the Materials and Methods. A representative histogram is shown for each mouse strain. The ratio of CD8α to CD4 DC subsets was calculated from values in the upper left and lower right quadrants. B, The percentage of DC as a fraction of total nucleated splenocytes (top panel), the percentage of individual DC subsets (middle panel) and the total number cells in each DC subset (bottom panel) in the spleen from the indicated gene-deficient or mAb-treated mice. Each data point represents the value obtained from an individual animal. Bars show the mean ± SD from at least n = three mice per group and the data are representative of three independent experiments. Student’s test was performed where * and ** denote a significance of p < 0.05 and p < 0.01, respectively, between the indicated groups. C, The effect of LTβR activation in wt B6 mice on DC subsets. The percentage of DC as a fraction of total nucleated splenocytes (top panel), the percentage of individual DC subsets (middle panel) and the total number cells in each DC subset (bottom panel) in the spleen from wt B6 or rat anti-mouse LTβR treated mice (as in A). Bars show the mean ± SD from at least two mice per group and the data are representative of two independent experiments. Student t test significance between the wt B6 and the other groups p < 0.05 (*). D, Total number (top panel) and frequency (bottom panel) of BrdU+ cells CD8α+, CD4+, and CD8α/CD4− DC in the spleen of wt B6, HVEM-, BTLA- and LIGHT/LTβ-deficient mice treated with BrdU for 16 h. Bars show the mean ± SD from at least three mice per group and the data are representative of two independent experiments. Student’s test was performed where * and *** denote significance of p < 0.05 and p < 0.001, respectively, between the indicated groups.
FIGURE 8
Alymphoplasia (NIK mutant) mice have a specific defect in CD8α- DC subsets. A, CD11chigh cells were analyzed for CD4 and CD8α expression from wt B6 and aly mice as described in the Materials and Methods. B, The percentage of DC as a fraction of total nucleated splenocytes (top panel), the percentage of individual DC subsets (middle panel) and the total number cells in each DC subset (bottom panel) in the spleen from wt B6 and aly mice. Each data point represents an individual animal, and the data are pooled from two analyses. Bars show the mean ± SD from at least n = three mice per group and the data are representative of three independent experiments. Student’s test was performed where one and three asterisks denote significance of p < 0.05 and p < 0.001, respectively, between the indicated groups.
Similar articles
- The signaling networks of the herpesvirus entry mediator (TNFRSF14) in immune regulation.
Steinberg MW, Cheung TC, Ware CF. Steinberg MW, et al. Immunol Rev. 2011 Nov;244(1):169-87. doi: 10.1111/j.1600-065X.2011.01064.x. Immunol Rev. 2011. PMID: 22017438 Free PMC article. Review. - The TNF receptor and Ig superfamily members form an integrated signaling circuit controlling dendritic cell homeostasis.
De Trez C, Ware CF. De Trez C, et al. Cytokine Growth Factor Rev. 2008 Jun-Aug;19(3-4):277-84. doi: 10.1016/j.cytogfr.2008.04.013. Epub 2008 Jun 3. Cytokine Growth Factor Rev. 2008. PMID: 18511331 Free PMC article. Review. - Targeting lymphocyte activation through the lymphotoxin and LIGHT pathways.
Ware CF. Ware CF. Immunol Rev. 2008 Jun;223:186-201. doi: 10.1111/j.1600-065X.2008.00629.x. Immunol Rev. 2008. PMID: 18613837 Free PMC article. Review. - The CD160, BTLA, LIGHT/HVEM pathway: a bidirectional switch regulating T-cell activation.
Cai G, Freeman GJ. Cai G, et al. Immunol Rev. 2009 May;229(1):244-58. doi: 10.1111/j.1600-065X.2009.00783.x. Immunol Rev. 2009. PMID: 19426226 Review. - Regulatory T cell expression of herpesvirus entry mediator suppresses the function of B and T lymphocyte attenuator-positive effector T cells.
Tao R, Wang L, Murphy KM, Fraser CC, Hancock WW. Tao R, et al. J Immunol. 2008 May 15;180(10):6649-55. doi: 10.4049/jimmunol.180.10.6649. J Immunol. 2008. PMID: 18453584
Cited by
- Co-inhibitory molecules: Controlling the effectors or controlling the controllers?
Thangavelu G, Smolarchuk C, Anderson CC. Thangavelu G, et al. Self Nonself. 2010 Apr;1(2):77-88. doi: 10.4161/self.1.2.11548. Epub 2010 Feb 16. Self Nonself. 2010. PMID: 21487510 Free PMC article. - BTLA/HVEM Signaling: Milestones in Research and Role in Chronic Hepatitis B Virus Infection.
Yu X, Zheng Y, Mao R, Su Z, Zhang J. Yu X, et al. Front Immunol. 2019 Mar 29;10:617. doi: 10.3389/fimmu.2019.00617. eCollection 2019. Front Immunol. 2019. PMID: 30984188 Free PMC article. Review. - Treg Depletion Licenses T Cell-Driven HEV Neogenesis and Promotes Tumor Destruction.
Colbeck EJ, Jones E, Hindley JP, Smart K, Schulz R, Browne M, Cutting S, Williams A, Parry L, Godkin A, Ware CF, Ager A, Gallimore A. Colbeck EJ, et al. Cancer Immunol Res. 2017 Nov;5(11):1005-1015. doi: 10.1158/2326-6066.CIR-17-0131. Epub 2017 Sep 25. Cancer Immunol Res. 2017. PMID: 28947544 Free PMC article. - Decreased B and T lymphocyte attenuator in Behcet's disease may trigger abnormal Th17 and Th1 immune responses.
Ye Z, Deng B, Wang C, Zhang D, Kijlstra A, Yang P. Ye Z, et al. Sci Rep. 2016 Feb 4;6:20401. doi: 10.1038/srep20401. Sci Rep. 2016. PMID: 26841832 Free PMC article. - The signaling networks of the herpesvirus entry mediator (TNFRSF14) in immune regulation.
Steinberg MW, Cheung TC, Ware CF. Steinberg MW, et al. Immunol Rev. 2011 Nov;244(1):169-87. doi: 10.1111/j.1600-065X.2011.01064.x. Immunol Rev. 2011. PMID: 22017438 Free PMC article. Review.
References
- Banchereau J, Briere F, Caux C, Davoust J, Lebecque S, Liu YJ, Pulendran B, Palucka K. Immunobiology of dendritic cells. Annu. Rev. Immunol. 2000;18:767–811. - PubMed
- Vremec D, Pooley J, Hochrein H, Wu L, Shortman K. CD4 and CD8 expression by dendritic cell subtypes in mouse thymus and spleen. J. Immunol. 2000;164:2978–2986. - PubMed
- Leenen PJ, Radosevic K, Voerman JS, Salomon B, van Rooijen N, Klatzmann D, van Ewijk W. Heterogeneity of mouse spleen dendritic cells: in vivo phagocytic activity, expression of macrophage markers, and subpopulation turnover. J. Immunol. 1998;160:2166–2173. - PubMed
- Maldonado-Lopez R, Moser M. Dendritic cell subsets and the regulation of Th1/Th2 responses. Semin. Immunol. 2001;13:275–282. - PubMed
Publication types
MeSH terms
Substances
Grants and funding
- AI06789/AI/NIAID NIH HHS/United States
- R01 AI067890-01A2/AI/NIAID NIH HHS/United States
- R01 AI067890/AI/NIAID NIH HHS/United States
- CA69381/CA/NCI NIH HHS/United States
- AI33068/AI/NIAID NIH HHS/United States
- R01 AI048073/AI/NIAID NIH HHS/United States
- P01 CA069381-120001/CA/NCI NIH HHS/United States
- AI48073/AI/NIAID NIH HHS/United States
- P01 CA069381/CA/NCI NIH HHS/United States
- R01 AI033068-07/AI/NIAID NIH HHS/United States
- R37 AI033068/AI/NIAID NIH HHS/United States
- R01 AI033068/AI/NIAID NIH HHS/United States
- R01 AI048073-07/AI/NIAID NIH HHS/United States
LinkOut - more resources
Full Text Sources
Other Literature Sources
Molecular Biology Databases
Research Materials
