Dynamic rerouting of the carbohydrate flux is key to counteracting oxidative stress - PubMed (original) (raw)
Dynamic rerouting of the carbohydrate flux is key to counteracting oxidative stress
Markus Ralser et al. J Biol. 2007.
Abstract
Background: Eukaryotic cells have evolved various response mechanisms to counteract the deleterious consequences of oxidative stress. Among these processes, metabolic alterations seem to play an important role.
Results: We recently discovered that yeast cells with reduced activity of the key glycolytic enzyme triosephosphate isomerase exhibit an increased resistance to the thiol-oxidizing reagent diamide. Here we show that this phenotype is conserved in Caenorhabditis elegans and that the underlying mechanism is based on a redirection of the metabolic flux from glycolysis to the pentose phosphate pathway, altering the redox equilibrium of the cytoplasmic NADP(H) pool. Remarkably, another key glycolytic enzyme, glyceraldehyde-3-phosphate dehydrogenase (GAPDH), is known to be inactivated in response to various oxidant treatments, and we show that this provokes a similar redirection of the metabolic flux.
Conclusion: The naturally occurring inactivation of GAPDH functions as a metabolic switch for rerouting the carbohydrate flux to counteract oxidative stress. As a consequence, altering the homoeostasis of cytoplasmic metabolites is a fundamental mechanism for balancing the redox state of eukaryotic cells under stress conditions.
Figures
Figure 1
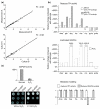
Reduced triosephosphate isomerase (TPI) activity increases oxidant resistance of S. cerevisiae and C. elegans. (a) The left panel shows a Western blot analysis of yeast cells expressing wild-type human TPI under the control of promoters of different strengths: GPD1 (GPD pr), TEF1 (TEF pr), and CYC1 (CYC pr). Yeast cells expressing human TPIIle170Val or yeast TPI under the control of the strong GPD1 promoter were used as controls. Equal loading of the lysates was controlled by visualizing G6PDH. The right panel shows yeast cells expressing yeast TPI and human TPIIle170Val controlled by the GPD1 promoter or yeast expressing wild-type human TPI controlled by the GPD1, TEF1 or CYC1 promoters, respectively. Yeast were spotted as fivefold serial dilutions on SC medium supplemented with different concentrations of diamide. Plates were incubated at 30°C for 3 days. (b) The left panel shows western blot analysis of cell extracts prepared from adult C. elegans that were fed with E. coli producing double-stranded RNA of the C. elegans tpi-1 gene (Y17G7B.7) (tpi-1 RNAi) or harboring the empty plasmid L4440 (control). The right panel shows the effects of the oxidants juglone and diamide on these worms. After feeding with E. coli as described above, worms were placed on agar plates supplemented with juglone or diamide. Multi-resistant daf-2 (e1370) mutant worms were included in every experiment as controls.
Figure 2
Reduced TPI activity protects against diamide by increasing the metabolic flux through the PPP. (a) Schematic illustration of a subset of biochemical reactions of the glycolytic pathway (left) and the associated pentose phosphate pathway (right). Solid lines represent direct, one-step biochemical reactions, and indirect, multi-step reactions are represented as dotted lines. GAPDH, glyceraldehyde-3-phosphate dehydrogenase. (b) Yeast deletion strains Δ_tpi1_Δ_zwf1_, Δ_tpi1_Δ_sol3_, and Δ_tpi1_Δ_sol4_ expressing wild-type human TPI or TPIIle170Val were spotted as fivefold serial dilutions on synthetic media supplemented with different concentrations of diamide, and plates were incubated at 30°C.
Figure 3
Reduced TPI activity protects against diamide by increasing NADPH. (a) S. cerevisiae strains MR101 and MR105 were grown in duplicate to mid-log phase, pyridine nucleotides were extracted, and LC-MS/MS measurements were performed in triplicate. MR105 cells expressing TPIIle170Val had a higher overall NADPH/NADP+ ratio compared with MR101 cells expressing wild-type TPI. (b) S. cerevisiae strain BY4741 was transformed with an empty 2μ plasmid or with a 2μ plasmid encoding K. lactis GDP1 (p1696). Afterwards, single transformants were selected, grown overnight and the same number of cells were spotted as fivefold serial dilutions on agar plates supplemented with different concentrations of diamide. Growth was monitored after plates were incubated at 30°C for 3 days. (c) The isogenic yeast strains MR101 expressing wild-type human TPI or MR105 expressing human TPIIle170Val were transformed with plasmids for expression of K. lactis GDP1 and processed as described in (b).
Figure 4
TPI and GAPDH inactivation increases the concentration of PPP metabolites. (a) For quality control of the metabolite quantifications and for analyzing the technical reproducibility, each metabolite was measured in duplicate (top panel). For analyzing the biological reproducibility, the metabolite concentrations were measured from cultures grown in parallel (bottom panel). Please note that for the purpose of illustration values greater than 10 are not shown. The complete plots are presented in Additional data file 3. (b) Upper panel, changes in metabolite levels in yeast strains with differing TPI activity. Lysates of yeast strains BY4741 (100% TPI activity), MR101 (70% TPI activity) and MR105 (20% TPI activity) were prepared and metabolites were quantified by LC-MS/MS. The absolute metabolite concentrations of MR101 and MR105 yeast were normalized and plotted as change given in percent relative to the wild-type (BY4741) strain. Middle panel, changes in metabolite levels in yeast with GAPDH inactivation. Cultures of strain BY4741 were treated with H2O2 or left untreated. The relative changes of the various metabolites of the H2O2-treated cells in comparison to untreated cells were plotted. Bottom panel, predicted qualitative changes in metabolite concentrations using the non-fitted metabolic model. Note that for technical reasons, the abbreviation g6p refers to the sum of glucose-6-phosphate and fructose-6-phosphate and x5p to the sum of xylulose-5-phosphate and ribulose-5-phosphate. (c) Upper panel, GAPDH activity in yeast cells treated with and without H2O2 as in (b). Lower panel, effect of H2O2 on wild-type yeast cells transformed with the 2μ plasmids p423GPD, p423GPD-EcoGAP encoding E. coli GAPDH, or p423GPD-TDH3 encoding the yeast GAPDH Tdh3p. Transformants were selected, grown overnight and the same number of cells were spotted as fivefold serial dilutions on SC-his-ade media supplemented with H2O2 as indicated.
Figure 5
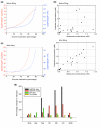
In silico model for the interplay of glycolysis and the pentose phosphate pathway in response to GAPDH or TPI inactivation. (a) Predicted changes of the cytoplasmic NADPH/NADP+ ratio of the unfitted model. The NADPH/NADP+ ratio increases in correlation with the rate of TPI (blue) or GAPDH (red) inactivation. (b) Quantitative accuracy of the metabolic model before and after parameter fitting. Upper panel, 21 measured metabolite concentrations (seven metabolites under three conditions) are plotted against the predicted values before fitting. Lower panel, data versus prediction after parameter fitting. (c) As (a), but after parameter fitting. (d) Comparison of quantitative predictions made with the parameter-fitted and the measured metabolite concentrations. Changes relative to the wild-type strain values are shown. Black and red bars correspond to yeast cells with inactivated GAPDH, green and yellow bars correspond to reduced TPI activity.
Figure 6
Lifespan analysis of S. cerevisiae and C. elegans. (a) The median replicative lifespan of yeast strains BY4741, MR130, MR131, MR136, and MR137 was determined by counting surviving mother cells per generation. (b) For the lifespan analysis of C. elegans the parental and the F1 generation (left panel, 117 wild-type and 80 tpi-1 RNAi animals were analyzed) or the F1 generation only (right panel, 74 wild-type and 47 tpi-1 RNAi animals) were placed on the respective agar plates and survival of the worms was monitored every day.
Similar articles
- Pyruvate kinase triggers a metabolic feedback loop that controls redox metabolism in respiring cells.
Grüning NM, Rinnerthaler M, Bluemlein K, Mülleder M, Wamelink MM, Lehrach H, Jakobs C, Breitenbach M, Ralser M. Grüning NM, et al. Cell Metab. 2011 Sep 7;14(3):415-27. doi: 10.1016/j.cmet.2011.06.017. Cell Metab. 2011. PMID: 21907146 Free PMC article. - Identification of the first fungal NADP-GAPDH from Kluyveromyces lactis.
Verho R, Richard P, Jonson PH, Sundqvist L, Londesborough J, Penttilä M. Verho R, et al. Biochemistry. 2002 Nov 19;41(46):13833-8. doi: 10.1021/bi0265325. Biochemistry. 2002. PMID: 12427047 - Triose phosphate isomerase deficiency is caused by altered dimerization--not catalytic inactivity--of the mutant enzymes.
Ralser M, Heeren G, Breitenbach M, Lehrach H, Krobitsch S. Ralser M, et al. PLoS One. 2006 Dec 20;1(1):e30. doi: 10.1371/journal.pone.0000030. PLoS One. 2006. PMID: 17183658 Free PMC article. - The Pentose Phosphate Pathway in Yeasts-More Than a Poor Cousin of Glycolysis.
Bertels LK, Fernández Murillo L, Heinisch JJ. Bertels LK, et al. Biomolecules. 2021 May 12;11(5):725. doi: 10.3390/biom11050725. Biomolecules. 2021. PMID: 34065948 Free PMC article. Review. - Reoxidation of the NADPH produced by the pentose phosphate pathway is necessary for the utilization of glucose by Kluyveromyces lactis rag2 mutants.
González Siso MI, Freire Picos MA, Cerdán ME. González Siso MI, et al. FEBS Lett. 1996 May 27;387(1):7-10. doi: 10.1016/0014-5793(96)00390-0. FEBS Lett. 1996. PMID: 8654569 Review.
Cited by
- Label-free liquid chromatography mass spectrometry analysis of changes in broiler liver proteins under transport stress.
Di Luca A, Bennato F, Ianni A, Martino C, Henry M, Meleady P, Martino G. Di Luca A, et al. PLoS One. 2024 Oct 28;19(10):e0311539. doi: 10.1371/journal.pone.0311539. eCollection 2024. PLoS One. 2024. PMID: 39466737 Free PMC article. - Fungal glyceraldehyde 3-phosphate dehydrogenase GpdC maintains glycolytic mechanism against reactive nitrogen stress-induced damage.
Kadooka C, Katsuki N, Masuo S, Kojima S, Amahisa M, Suzuki K, Doi Y, Takeshita N, Takaya N. Kadooka C, et al. Front Microbiol. 2024 Oct 11;15:1475567. doi: 10.3389/fmicb.2024.1475567. eCollection 2024. Front Microbiol. 2024. PMID: 39464399 Free PMC article. - Protein vicinal thiols as intrinsic probes of brain redox states in health, aging, and ischemia.
Foley TD, Huang WC, Petsche EA, Fleming ER, Hornickle JC. Foley TD, et al. Metab Brain Dis. 2024 Jun;39(5):929-940. doi: 10.1007/s11011-024-01370-3. Epub 2024 Jun 7. Metab Brain Dis. 2024. PMID: 38848024 Free PMC article. - The immune response to RNA suppresses nucleic acid synthesis by limiting ribose 5-phosphate.
Bhattacharjee P, Wang D, Anderson D, Buckler JN, de Geus E, Yan F, Polekhina G, Schittenhelm R, Creek DJ, Harris LD, Sadler AJ. Bhattacharjee P, et al. EMBO J. 2024 Jul;43(13):2636-2660. doi: 10.1038/s44318-024-00100-w. Epub 2024 May 22. EMBO J. 2024. PMID: 38778156 Free PMC article. - Monogenic Disorders of ROS Production and the Primary Anti-Oxidative Defense.
Grüning NM, Ralser M. Grüning NM, et al. Biomolecules. 2024 Feb 9;14(2):206. doi: 10.3390/biom14020206. Biomolecules. 2024. PMID: 38397443 Free PMC article. Review.
References
Publication types
MeSH terms
Substances
LinkOut - more resources
Full Text Sources
Other Literature Sources
Molecular Biology Databases
Research Materials


