Comparative analysis of microarray data identifies common responses to caloric restriction among mouse tissues - PubMed (original) (raw)
Comparative Study
Comparative analysis of microarray data identifies common responses to caloric restriction among mouse tissues
William R Swindell. Mech Ageing Dev. 2008 Mar.
Abstract
Caloric restriction has been extensively investigated as an intervention that both extends lifespan and delays age-related disease in mammals. In mice, much interest has centered on evaluating gene expression changes induced by caloric restriction (CR) in particular tissue types, but the overall systemic effect of CR among multiple tissues has been examined less extensively. This study presents a comparative analysis of microarray datasets that have collectively examined the effects of CR in 10 different tissue types (liver, heart, muscle, hypothalamus, hippocampus, white adipose tissue, colon, kidney, lung and cochlea). Using novel methods for comparative analysis of microarray data, detailed comparisons of the effects of CR among tissues are provided, and 28 genes for which expression response to CR is most shared among tissues are identified. These genes characterize common responses to CR, which consist of both activation and inhibition of stress-response pathways. With respect to liver tissue, transcriptional effects of CR exhibited surprisingly little overlap with those of aging, and a variable degree of overlap with the potential CR-mimetic drug resveratrol. These analyses shed light on the systemic transcriptional activity associated with CR diets, and also illustrate new approaches for comparative analysis of microarray datasets in the context of aging biology.
Figures
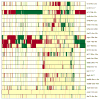
Figure 1
Differential expression signatures. Each row corresponds to a contrast that evaluates the effects of CR on the expression of a large number of genes (see Table 1). Information listed in Table 1 has been incorporated into the labels shown in the figure. Labels indicate the contrast ID, followed by the duration of CR and the age at which CR was initiated. Within a given row, genes upregulated by CR are shown in red, while genes downregulated by CR are shown in green. Light yellow regions correspond to genes for which expression is not significantly affected by CR and blank white regions indicate where data was not available. The ordering of signatures corresponds to that generated by hierarchical clustering analysis (see Figure 2). Cluster analysis was based on all genes for which data was available. Signatures displayed in the figure, however, are based on a subset of 1347 genes, which were obtained by filtering to eliminate genes not differentially expressed with respect to more than two signatures.
Figure 2
Differential expression signature cluster analysis. The dendrogram provides results of a cluster analysis performed on differential expression signatures using the similarity metric described by Equation (1). Each leaf corresponds to a contrast involving the effects of caloric restriction (see Table 1). Information listed in Table 1 has been incorporated into the leaf labels shown in the figure. Labels indicate the contrast ID, followed by the duration of CR and the age at which CR was initiated. The horizontal axis indicates the average level of dissimilarity at which two clusters were joined, where dissimilarity is defined as 1 − s (see Equation 1).
Figure 3
Overlap of differential expression signatures. (A) A total of 719 probesets were induced by CR with respect to contrast hrt7, while 120 probesets were induced by CR with respect to contrast hrt8b (see Table 1). The Venn diagram shows the overlap between these two groups, where up and down triangles indicate the number of probesets up and downregulated, respectively. (B) The overlap between differential expression signatures associated with hrt7 and hrt8b consists of T = 8 + 14 = 22 probesets (see Equation 2). Part (B) shows the null distribution of T generated by simulation under the null hypothesis that the probability of differential expression with respect to contrast hrt7 is independent of the probability of differential expression with respect to hrt8b. The dotted vertical line indicates the observed value of T = 22, as indicated in the overlap region of the Venn Diagrams shown in part (A).
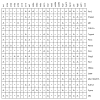
Figure 4
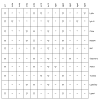
Genes upregulated by CR in five or more tissue types. A total of 16 genes met this criterion and are included in the figure. Each row corresponds to an individual gene, while each column corresponds to a contrast (see Table 1). Within the grid, up-triangles indicate a gene was significantly upregulated by CR, and down-triangles indicate a gene was significantly downregulated by CR. A dash indicates where a gene was not significantly induced by CR, and “×” indicates where data was not available.
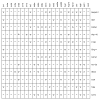
Figure 5
Genes downregulated by CR in five or more tissue types. A total of 12 genes met this criterion and are included in the figure. Each row corresponds to an individual gene, while each column corresponds to a contrast (see Table 1). Grid symbols are described in the Figure 4 legend.
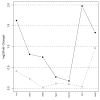
Figure 6
Effects of CR on Per2 versus Sirt1 expression. Solid circles connected by solid lines represent log-transformed fold-changes associated with Per2, and open circles connected by dotted lines represent log-transformed fold-changes associated with Sirt1. The horizontal axis indicates the contrast to which each symbol corresponds. Since Sirt1 was not represented on all microarray platforms considered, only seven contrasts for which data was available are listed. In some cases, Per2 and/or Sirt1 genes were represented by multiple probesets. In these instances, log-transformed fold-change was calculated for each probeset individually, and the maximum value associated with each gene is plotted in the figure.
Figure 7
Effects of CR and aging in liver: Differential expression signature cluster analysis. Differential expression signatures associated with the effects of CR in liver tissue were clustered together with those corresponding to the effects of aging in liver. The similarity metric described by Equation (1) was used to cluster signatures, and the horizontal axis indicates the average level of dissimilarity at which two clusters were joined (dissimilarity = 1 − s). Aging effects were defined as Young – Old, such that age signatures would be comparable to the effect of CR, defined as CR – control. Supplemental Data File 2 includes a heatmap image of differential expression signatures shown in the figure. Supplemental Data File 3 provides a similarity matrix of differential expression signatures and provides indication of which pairwise signature comparisons were associated with significant levels of overlap.
Figure 8
Effects of CR and aging in liver: Genes upregulated by CR and downregulated by aging. A total of 10 genes were upregulated by CR with respect to three or more liver contrasts, and downregulated with respect to at least one aging contrast. Each row corresponds to an individual gene, while each column corresponds to a CR or age contrast associated with liver tissue. For lvr contrasts, triangles indicate whether a gene was significantly up or downregulated by CR. For age contrasts, up-triangles indicate where expression was significantly higher in young mice versus old mice, and down-triangles indicate where expression was significantly lower in young mice versus old mice. For all contrasts, the dash indicates where either CR or aging had no significant effect on gene expression. It should be noted that genes Slc20a1 and Grem2 do not meet selection criteria if CR data generated from a long-lived mutant mouse strain are excluded from the analysis (contrast lvr4b).
Figure 9
Effects of CR and aging in liver: Genes downregulated by CR and upregulated by aging. A total of 10 genes were downregulated by CR with respect to three or more lvr contrasts, and upregulated with respect to at least one age contrast. Each row corresponds to an individual gene, while each column corresponds to a CR or age contrast associated with liver tissue. Symbols used within the grid a defined in the Figure 8 legend.
Figure 10
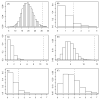
Effects of CR and resveratrol in liver. The effects of resveratrol in liver were evaluated by Baur et al. (2006) (Gene Expression Omnibus series GSE6089). Differential expression signatures from data generated by Baur et al. (2006) were compared to those associated with the effects of CR in liver (lvr1, lvr4a, lvr4b, lvr5a, lvr5b, lvr10, lvr13). Each panel shows the null distribution of T associated with each comparison (see Methods), along with the observed value of T (dotted vertical line). The panels correspond to the comparison of the resveratrol differential expression signature to (A) lvr1, (B) lvr4a, (C) lvr5a, (D) lvr5b, (E) lvr10 and (F) lvr13 (lvr4b is not shown).
Similar articles
- Genes and gene expression modules associated with caloric restriction and aging in the laboratory mouse.
Swindell WR. Swindell WR. BMC Genomics. 2009 Dec 7;10:585. doi: 10.1186/1471-2164-10-585. BMC Genomics. 2009. PMID: 19968875 Free PMC article. - Transcriptional response to aging and caloric restriction in heart and adipose tissue.
Linford NJ, Beyer RP, Gollahon K, Krajcik RA, Malloy VL, Demas V, Burmer GC, Rabinovitch PS. Linford NJ, et al. Aging Cell. 2007 Oct;6(5):673-88. doi: 10.1111/j.1474-9726.2007.00319.x. Aging Cell. 2007. PMID: 17874999 - Identification of tissue-specific transcriptional markers of caloric restriction in the mouse and their use to evaluate caloric restriction mimetics.
Barger JL, Vann JM, Cray NL, Pugh TD, Mastaloudis A, Hester SN, Wood SM, Newton MA, Weindruch R, Prolla TA. Barger JL, et al. Aging Cell. 2017 Aug;16(4):750-760. doi: 10.1111/acel.12608. Epub 2017 May 26. Aging Cell. 2017. PMID: 28556428 Free PMC article. - Lessons learned from gene expression profile studies of aging and caloric restriction.
Park SK, Prolla TA. Park SK, et al. Ageing Res Rev. 2005 Jan;4(1):55-65. doi: 10.1016/j.arr.2004.09.003. Epub 2004 Dec 8. Ageing Res Rev. 2005. PMID: 15619470 Review. - Transcriptional impact of dietary methionine restriction on systemic inflammation: relevance to biomarkers of metabolic disease during aging.
Wanders D, Ghosh S, Stone KP, Van NT, Gettys TW. Wanders D, et al. Biofactors. 2014 Jan-Feb;40(1):13-26. doi: 10.1002/biof.1111. Epub 2013 Jun 29. Biofactors. 2014. PMID: 23813805 Free PMC article. Review.
Cited by
- Biological aging alters circadian mechanisms in murine adipose tissue depots.
Sutton GM, Ptitsyn AA, Floyd ZE, Yu G, Wu X, Hamel K, Shah FS, Centanni A, Eilertsen K, Kheterpal I, Newman S, Leonardi C, Freitas MA, Bunnell BA, Gimble JM. Sutton GM, et al. Age (Dordr). 2013 Jun;35(3):533-47. doi: 10.1007/s11357-012-9389-7. Epub 2012 Mar 13. Age (Dordr). 2013. PMID: 22411258 Free PMC article. - mTOR regulates the expression of DNA damage response enzymes in long-lived Snell dwarf, GHRKO, and PAPPA-KO mice.
Dominick G, Bowman J, Li X, Miller RA, Garcia GG. Dominick G, et al. Aging Cell. 2017 Feb;16(1):52-60. doi: 10.1111/acel.12525. Epub 2016 Sep 13. Aging Cell. 2017. PMID: 27618784 Free PMC article. - Gene expression in the hippocampus: regionally specific effects of aging and caloric restriction.
Zeier Z, Madorsky I, Xu Y, Ogle WO, Notterpek L, Foster TC. Zeier Z, et al. Mech Ageing Dev. 2011 Jan-Feb;132(1-2):8-19. doi: 10.1016/j.mad.2010.10.006. Epub 2010 Nov 3. Mech Ageing Dev. 2011. PMID: 21055414 Free PMC article. - Aging on a different scale--chronological versus pathology-related aging.
Melis JP, Jonker MJ, Vijg J, Hoeijmakers JH, Breit TM, van Steeg H. Melis JP, et al. Aging (Albany NY). 2013 Oct;5(10):782-8. doi: 10.18632/aging.100606. Aging (Albany NY). 2013. PMID: 24131799 Free PMC article. - A conserved transcriptional signature of delayed aging and reduced disease vulnerability is partially mediated by SIRT3.
Barger JL, Anderson RM, Newton MA, da Silva C, Vann JA, Pugh TD, Someya S, Prolla TA, Weindruch R. Barger JL, et al. PLoS One. 2015 Apr 1;10(4):e0120738. doi: 10.1371/journal.pone.0120738. eCollection 2015. PLoS One. 2015. PMID: 25830335 Free PMC article.
References
- Amador-Noguez D, Yagi K, Venable S, Darlington G. Gene expression profile of long-lived Ames dwarf mice and Little mice. Aging Cell. 2004;3:423–441. - PubMed
- Apte UM, Limaye PB, Desaiah D, Bucci TJ, Warbritton A, Mehendale HM. Mechanisms of increased liver tissue repair and survival in diet-restricted rats treated with equitoxic doses of thioacetamide. Toxicol Sci. 2003;72:272–282. - PubMed
- Astrup A. Healthy lifestyles in Europe: prevention of obesity and type II diabetes by diet and physical activity. Public Health Nutr. 2001;4:499–515. - PubMed
- Bardakci F, Arslan S, Bardakci S, Binatli AO, Budak M. Sulfotransferase 1A1 (Sult1A1) polymorphism and susceptibility to primary brain tumors. J Cancer Res Clin Oncol. 2007 in press. - PubMed
Publication types
MeSH terms
LinkOut - more resources
Full Text Sources
Other Literature Sources
Medical
