Empirical comparison of Simple Sequence Repeats and single nucleotide polymorphisms in assessment of maize diversity and relatedness - PubMed (original) (raw)
Comparative Study
Empirical comparison of Simple Sequence Repeats and single nucleotide polymorphisms in assessment of maize diversity and relatedness
Martha T Hamblin et al. PLoS One. 2007.
Abstract
While Simple Sequence Repeats (SSRs) are extremely useful genetic markers, recent advances in technology have produced a shift toward use of single nucleotide polymorphisms (SNPs). The different mutational properties of these two classes of markers result in differences in heterozygosities and allele frequencies that may have implications for their use in assessing relatedness and evaluation of genetic diversity. We compared analyses based on 89 SSRs (primarily dinucleotide repeats) to analyses based on 847 SNPs in individuals from the same 259 inbred maize lines, which had been chosen to represent the diversity available among current and historic lines used in breeding. The SSRs performed better at clustering germplasm into populations than did a set of 847 SNPs or 554 SNP haplotypes, and SSRs provided more resolution in measuring genetic distance based on allele-sharing. Except for closely related pairs of individuals, measures of distance based on SSRs were only weakly correlated with measures of distance based on SNPs. Our results suggest that 1) large numbers of SNP loci will be required to replace highly polymorphic SSRs in studies of diversity and relatedness and 2) relatedness among highly-diverged maize lines is difficult to measure accurately regardless of the marker system.
Conflict of interest statement
Competing Interests: The authors have declared that no competing interests exist.
Figures
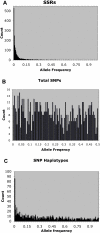
Figure 1. Allele frequency spectra for different classes of markers.
Note that the scale on the x axis is different for total SNPs, because only this class is biallelic.
Figure 2. Estimated ln(probability of the data) and Var[ln(probability of the data)] for k from 2 to 5.
Values are from STRUCTURE run three times at each value of k, using A) 89 SSRs; B) 847 SNPs; C) 554 SNP haplotypes; D) 89 SSRs+847 SNPs. The blue diamonds are ln(probability of the data) and the pink squares are var[ln(probability of the data)].
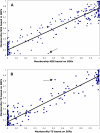
Figure 3. Comparison of membership in population clusters based on marker class.
Each point represents one individual's proportion of ancestry in the NSS (top panel) or TS (bottom panel) cluster, based on SSR (x axis) or SNP (y axis) data assuming three populations. The arrows indicate line F2834T (see text).
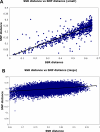
Figure 4. Correlation between genetic distance based on SSRs and SNPs.
Each point represents the genetic distance between a pair of individuals, based on sharing of SSR (x axis) or SNP (y axis) alleles. The top panel shows the relationship for pairs of individuals whose SSR distance is <0.65; the bottom panel shows the relationship for pairs of individuals whose SSR distance is ≥0.65.
Similar articles
- A comparison of simple sequence repeat and single nucleotide polymorphism marker technologies for the genotypic analysis of maize (Zea mays L.).
Jones ES, Sullivan H, Bhattramakki D, Smith JS. Jones ES, et al. Theor Appl Genet. 2007 Aug;115(3):361-71. doi: 10.1007/s00122-007-0570-9. Epub 2007 May 22. Theor Appl Genet. 2007. PMID: 17639299 - Genetic diversity analysis of elite European maize (Zea mays L.) inbred lines using AFLP, SSR, and SNP markers reveals ascertainment bias for a subset of SNPs.
Frascaroli E, Schrag TA, Melchinger AE. Frascaroli E, et al. Theor Appl Genet. 2013 Jan;126(1):133-41. doi: 10.1007/s00122-012-1968-6. Epub 2012 Sep 4. Theor Appl Genet. 2013. PMID: 22945268 - Comparison of SSRs and SNPs in assessment of genetic relatedness in maize.
Yang X, Xu Y, Shah T, Li H, Han Z, Li J, Yan J. Yang X, et al. Genetica. 2011 Aug;139(8):1045-54. doi: 10.1007/s10709-011-9606-9. Epub 2011 Sep 9. Genetica. 2011. PMID: 21904888 - Population structure and genetic diversity in a commercial maize breeding program assessed with SSR and SNP markers.
Van Inghelandt D, Melchinger AE, Lebreton C, Stich B. Van Inghelandt D, et al. Theor Appl Genet. 2010 May;120(7):1289-99. doi: 10.1007/s00122-009-1256-2. Epub 2010 Jan 10. Theor Appl Genet. 2010. PMID: 20063144 Free PMC article. - SNP frequency, haplotype structure and linkage disequilibrium in elite maize inbred lines.
Ching A, Caldwell KS, Jung M, Dolan M, Smith OS, Tingey S, Morgante M, Rafalski AJ. Ching A, et al. BMC Genet. 2002 Oct 7;3:19. doi: 10.1186/1471-2156-3-19. Epub 2002 Oct 7. BMC Genet. 2002. PMID: 12366868 Free PMC article.
Cited by
- Development and validation of 697 novel polymorphic genomic and EST-SSR markers in the American cranberry (Vaccinium macrocarpon Ait.).
Schlautman B, Fajardo D, Bougie T, Wiesman E, Polashock J, Vorsa N, Steffan S, Zalapa J. Schlautman B, et al. Molecules. 2015 Jan 27;20(2):2001-13. doi: 10.3390/molecules20022001. Molecules. 2015. PMID: 25633331 Free PMC article. - Genome-wide SNP and microsatellite variation illuminate population-level epidemiology in the Leishmania donovani species complex.
Downing T, Stark O, Vanaerschot M, Imamura H, Sanders M, Decuypere S, de Doncker S, Maes I, Rijal S, Sundar S, Dujardin JC, Berriman M, Schönian G. Downing T, et al. Infect Genet Evol. 2012 Jan;12(1):149-59. doi: 10.1016/j.meegid.2011.11.005. Epub 2011 Nov 20. Infect Genet Evol. 2012. PMID: 22119748 Free PMC article. - High Genetic Diversity in the Himalayan Common Bean (Phaseolus vulgaris) Germplasm with Divergence from Its Center of Origin in the Mesoamerica and Andes.
Nawaz I, Zeb T, Ali GM, Zeb BS, Jalal A, Rehman MU, Bakht T, Ali S. Nawaz I, et al. ACS Omega. 2023 Dec 11;8(51):48787-48797. doi: 10.1021/acsomega.3c05150. eCollection 2023 Dec 26. ACS Omega. 2023. PMID: 38162784 Free PMC article. - Molecular characterization of diverse CIMMYT maize inbred lines from eastern and southern Africa using single nucleotide polymorphic markers.
Semagn K, Magorokosho C, Vivek BS, Makumbi D, Beyene Y, Mugo S, Prasanna BM, Warburton ML. Semagn K, et al. BMC Genomics. 2012 Mar 25;13:113. doi: 10.1186/1471-2164-13-113. BMC Genomics. 2012. PMID: 22443094 Free PMC article. - Genetic variability and spatial distribution in small geographic scale of Aedes aegypti (Diptera: Culicidae) under different climatic conditions in Northeastern Brazil.
Steffler LM, Dolabella SS, Ribolla PE, Dreyer CS, Araújo ED, Oliveira RG, Martins WF, La Corte R. Steffler LM, et al. Parasit Vectors. 2016 Oct 4;9(1):530. doi: 10.1186/s13071-016-1814-9. Parasit Vectors. 2016. PMID: 27716392 Free PMC article.
References
- Smith JSC, Chin ECL, Shu H, Smith OS, Wall SJ, et al. An evaluation of the utility of SSR loci as molecular markers in maize (Zea mays L.): comparisons with data from RFLPs and pedigree. Theor Appl Genet. 1997;95:163–173.
- Rafalski A. Applications of single nucleotide polymorphisms in crop genetics. Curr Opin Plant Biol. 2002;5:94–100. - PubMed
- Schlotterer C. The evolution of molecular markers–just a matter of fashion? Nature Rev Genet. 2004;5:63–69. - PubMed
- Morin PA, Luikart G, Wayne RK the SNP workshop group. SNPs in ecology, evolution and conservation. Trends Ecol Evol. 2004;19:208–216.
- Kennedy GC, Matsuzaki H, Dong S, Liu WM, Huang J, et al. Large scale genotyping of complex DNA. Nature Biotechnol. 2003;21:1233–1237. - PubMed
Publication types
MeSH terms
Substances
LinkOut - more resources
Full Text Sources


