Early embryonic lethality of mice lacking ZO-2, but Not ZO-3, reveals critical and nonredundant roles for individual zonula occludens proteins in mammalian development - PubMed (original) (raw)
Early embryonic lethality of mice lacking ZO-2, but Not ZO-3, reveals critical and nonredundant roles for individual zonula occludens proteins in mammalian development
Jianliang Xu et al. Mol Cell Biol. 2008 Mar.
Abstract
ZO-1, ZO-2, and ZO-3 are closely related scaffolding proteins that link tight junction (TJ) transmembrane proteins such as claudins, junctional adhesion molecules, and occludin to the actin cytoskeleton. Even though the zonula occludens (ZO) proteins are among the first TJ proteins to have been identified and have undergone extensive biochemical analysis, little is known about the physiological roles of individual ZO proteins in different tissues or during vertebrate development. Here, we show that ZO-3 knockout mice lack an obvious phenotype. In contrast, embryos deficient for ZO-2 die shortly after implantation due to an arrest in early gastrulation. ZO-2(-)(/)(-) embryos show decreased proliferation at embryonic day 6.5 (E6.5) and increased apoptosis at E7.5 compared to wild-type embryos. The asymmetric distribution of prominin and E-cadherin to the apical and lateral plasma membrane domains, respectively, is maintained in cells of ZO-2(-)(/)(-) embryos. However, the architecture of the apical junctional complex is altered, and paracellular permeability of a low-molecular-weight tracer is increased in ZO-2(-/-) embryos. Leaky TJs and, given the association of ZO-2 with connexins and several transcription factors, effects on gap junctions and gene expression, respectively, are likely causes for embryonic lethality. Thus, ZO-2 is required for mouse embryonic development, but ZO-3 is dispensable. This is to our knowledge the first report showing that an individual ZO protein plays a nonredundant and critical role in mammalian development.
Figures
FIG. 1.
Targeting of the ZO-2 and ZO-3 loci and genotyping. (A and B) Targeting strategy. Schematic representations of the genomic locus of ZO-2 (A) and ZO-3 (B) showing exon 2 (with the initiation ATG) and exon 3 (gray boxes). The targeting vectors are designed to disrupt exon 2 by the in-frame insertion of a lacZ gene and a _loxP_-flanked neomycin cassette immediately downstream of the ATG codon. Bars indicate the regions to which probes used for Southern blot analysis hybridize; arrows denote the regions where primers used for genotyping anneal. (C to E) Homologous recombination in ESCs. Southern blot of ScaI-digested genomic DNA of selected ESC clones hybridized with labeled DNA probes hybridizing to genomic DNA (C and D) or the neomycin gene (E), as described in panels A and B, for the identification of homologous recombinants. ScaI fragments of 11.5- and 6.7-kb (ZO-2) or 10.6- and 5.8-kb (ZO-3) corresponding to the WT and targeted mutant alleles, respectively, are detected in targeted (+/−) ESC clones, whereas only the fragment corresponding to the WT allele is present in controls (+/+). (F and G) Genotyping of transgenic mice. Genomic DNA was amplified by PCR using primers designed to distinguish between WT and mutant alleles, as described in panels A and B. Fragments of 580 bp are 679 bp are indicative of the presence of the recombined mutant allele of ZO-2 and ZO-3, respectively, while the 367-bp and 297-bp fragments denote the WT allele. No _ZO-2_−/− mice were detected in newborn litters. (H) Western blot detection of ZO-3 protein. Lysates of intestine and liver from postnatal day 9 ZO-3+/+ and _ZO-3_−/− littermates were fractionated by SDS-polyacrylamide gel electrophoresis, transferred to membranes, and blotted with antibodies to ZO-3.
FIG. 2.
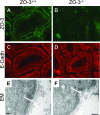
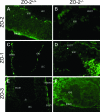
E-cadherin expression and TJ morphology in intestinal epithelial cells of _ZO-3_−/− mice. (A to D) ZO-3 expression and E-cadherin localization. Sections of intestines from ZO-3+/+ or _ZO-3_−/− littermates were stained with antibodies to ZO-3 (A and B) or E-cadherin (C and D) and fluorescently labeled secondary antibodies. (E and F) TJ morphology. Electron micrographs (EM) of intestinal sections of ZO-3+/+ and _ZO-3_−/− mice showing the electron-dense plaques of the apical junctional complex between adjacent epithelial cells. Bars, 0.5 μm (E) and 1 μm (F).
FIG. 3.
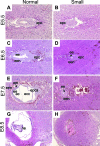
Postimplantation development of _ZO-2_−/− embryos. Histology of embryos with typical normal or abnormal appearance at E5.5 (A and B), E6.5 (C and D), E7.5 (E and F), and E8.5 (G and H). Note the developmental arrest of _ZO-2_−/− embryos from E5.5 onwards and eventual resorption. epc, extraplacental cone; ac, amniotic cavity, ecc, exocoelomic cavity; epca, ectoplacental cavity; ne, neural ectoderm.
FIG. 4.
Developmental arrest of _ZO-2_−/− embryos. ZO-2+/+ and _ZO-2_−/− embryos dissected from their deciduas at E6.5, E7.5, and E8.5. Note the overall smaller size and developmental arrest of _ZO-2_−/− embryos. epc, extraplacental cone.
FIG. 5.
Cell proliferation is compromised in E6.5 _ZO-2_−/− embryos. ZO-2+/+ (A and B) and _ZO-2_−/− (C and D) E6.5 embryos were labeled with BrdU and incorporated BrdU (green; A and C), and nuclei (blue; B andD) were visualized in sections by fluorescence microscopy. pac, proamniotic cavity; epc, extraplacental cone.
FIG. 6.
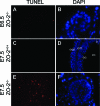
Enhanced apoptosis in E7.5 _ZO-2_−/− embryos. Apoptosis in _ZO-2_−/− (A, B, E, and F) and ZO-2+/+ (C and D) embryos at E6.5 (A and B) or E7.5 (C to F) was visualized by fluorescence microscopy using the TUNEL assay (red; A, C, and E). Nuclei are stained in blue (B, D, and F). a, amnion; ac, amniotic cavity; ee, embryonic ectoderm, em, embryonic mesoderm, een, embryonic endoderm.
FIG. 7.
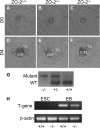
_ZO-2_−/− blastocysts differentiate inner cell mass and trophoblast tissue in vitro and express the mesoderm marker T gene. (A to F) Blastocyst cultures. Micrographs of E3.5 ZO-2+/+ (A and D), ZO-2+/− (B and E), or _ZO-2_−/− (C and F) blastocysts after isolation (day 0 [D0]) (A to C) or 4-day (D4) in vitro culture (D to F). Note the normal development of inner cell mass (ICM) and trophoblast outgrowth (TG) for _ZO-2_−/− blastocysts. (G) Genotyping. Blastocysts were genotyped by reverse transcription-PCR, yielding 367-bp and 580-bp fragments for the WT and inactivated ZO-2 alleles, respectively. (H) T-gene expression. Reverse transcription-PCR was used to assess the expression of T gene in ZO-2+/+ or _ZO-2_−/− ESCs and EBs.
FIG. 8.
Distribution of ZO-1 and ZO-3 in _ZO-2_−/− embryos is not altered. Sections of E7.5 ZO-2+/+ (A, C, and E) and _ZO-2_−/− (B, D, and F) embryos were labeled with antibodies to ZO-2 (A and B), ZO-1 (C and D), or ZO-3 (E and F) and visualized by fluorescence microscopy. a, amnion; ac, amniotic cavity; ee, embryonic ectoderm; een, embryonic endoderm; exen, extraembryonic endoderm; exe, extraembryonic ectoderm.
FIG. 9.
Apical-basal polarity is not affected in _ZO-2_−/− embryos. Sections of E7.5 ZO-2+/+ (A and C) and _ZO-2_−/− (B and D) embryos were labeled with antibodies to the apical marker prominin (A and B) and the lateral maker E-cadherin (B and D) and visualized by fluorescence microscopy. ac, amniotic cavity; ee, embryonic ectoderm; een, extraembryonic endoderm; ee, embryonic ectoderm; embryonic mesoderm.
FIG. 10.
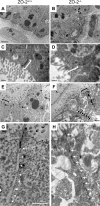
The structure and permeability barrier of the apical junctional complex are altered in cells of _ZO-2_−/− embryos. (A to D) Structure. E6.5 (data not shown) and E7.5 embryo sections were analyzed by transmission electron microscopy to visualize the apical junctional complex. Typical electron-dense plaques were readily detected at the apical pole of the lateral membrane of adjacent cells of control embryos (A and C) but were rarely observed in cells of _ZO-2_−/− embryos (B and D). _ZO-2_−/− embryos were identified based on their small size compared to WT and heterozygous embryos. Bars, 5 μm (A and B) and 0.5 μm (C and D). (E and F) Lanthanum permeability. E7.5 embryos were postfixed in lanthanum nitrate and processed for transmission electron microscopy. Note the presence of lanthanum (black arrows) in intercellular spaces of _ZO-2_−/− (E) but not control (F) embryos. Bar, 2 μm. (G and H) Higher magnification of the TJs highlighted with square brackets in panels E and F. Bar, 1 μm.
Similar articles
- Normal establishment of epithelial tight junctions in mice and cultured cells lacking expression of ZO-3, a tight-junction MAGUK protein.
Adachi M, Inoko A, Hata M, Furuse K, Umeda K, Itoh M, Tsukita S. Adachi M, et al. Mol Cell Biol. 2006 Dec;26(23):9003-15. doi: 10.1128/MCB.01811-05. Epub 2006 Sep 25. Mol Cell Biol. 2006. PMID: 17000770 Free PMC article. - Vertebrate animal models unravel physiological roles for zonula occludens tight junction adaptor proteins.
Hunziker W, Kiener TK, Xu J. Hunziker W, et al. Ann N Y Acad Sci. 2009 May;1165:28-33. doi: 10.1111/j.1749-6632.2009.04033.x. Ann N Y Acad Sci. 2009. PMID: 19538284 - Deficiency of zonula occludens-1 causes embryonic lethal phenotype associated with defected yolk sac angiogenesis and apoptosis of embryonic cells.
Katsuno T, Umeda K, Matsui T, Hata M, Tamura A, Itoh M, Takeuchi K, Fujimori T, Nabeshima Y, Noda T, Tsukita S, Tsukita S. Katsuno T, et al. Mol Biol Cell. 2008 Jun;19(6):2465-75. doi: 10.1091/mbc.e07-12-1215. Epub 2008 Mar 19. Mol Biol Cell. 2008. PMID: 18353970 Free PMC article. - Tight junction-based epithelial microenvironment and cell proliferation.
Tsukita S, Yamazaki Y, Katsuno T, Tamura A, Tsukita S. Tsukita S, et al. Oncogene. 2008 Nov 24;27(55):6930-8. doi: 10.1038/onc.2008.344. Oncogene. 2008. PMID: 19029935 Review. - MAGUK proteins: structure and role in the tight junction.
González-Mariscal L, Betanzos A, Avila-Flores A. González-Mariscal L, et al. Semin Cell Dev Biol. 2000 Aug;11(4):315-24. doi: 10.1006/scdb.2000.0178. Semin Cell Dev Biol. 2000. PMID: 10966866 Review.
Cited by
- CK2-dependent phosphorylation of occludin regulates the interaction with ZO-proteins and tight junction integrity.
Dörfel MJ, Westphal JK, Bellmann C, Krug SM, Cording J, Mittag S, Tauber R, Fromm M, Blasig IE, Huber O. Dörfel MJ, et al. Cell Commun Signal. 2013 Jun 10;11(1):40. doi: 10.1186/1478-811X-11-40. Cell Commun Signal. 2013. PMID: 23758859 Free PMC article. - Modulation of tight junction structure and function by kinases and phosphatases targeting occludin.
Dörfel MJ, Huber O. Dörfel MJ, et al. J Biomed Biotechnol. 2012;2012:807356. doi: 10.1155/2012/807356. Epub 2012 Jan 23. J Biomed Biotechnol. 2012. PMID: 22315516 Free PMC article. Review. - Moving Past Anti-VEGF: Novel Therapies for Treating Diabetic Retinopathy.
Bolinger MT, Antonetti DA. Bolinger MT, et al. Int J Mol Sci. 2016 Sep 7;17(9):1498. doi: 10.3390/ijms17091498. Int J Mol Sci. 2016. PMID: 27618014 Free PMC article. Review. - Breaking barriers. New insights into airway epithelial barrier function in health and disease.
Rezaee F, Georas SN. Rezaee F, et al. Am J Respir Cell Mol Biol. 2014 May;50(5):857-69. doi: 10.1165/rcmb.2013-0541RT. Am J Respir Cell Mol Biol. 2014. PMID: 24467704 Free PMC article. Review. - Organization and signaling of endothelial cell-to-cell junctions in various regions of the blood and lymphatic vascular trees.
Dejana E, Orsenigo F, Molendini C, Baluk P, McDonald DM. Dejana E, et al. Cell Tissue Res. 2009 Jan;335(1):17-25. doi: 10.1007/s00441-008-0694-5. Epub 2008 Oct 15. Cell Tissue Res. 2009. PMID: 18855014 Free PMC article. Review.
References
- Anderson, J. M., C. M. Van Itallie, and A. S. Fanning. 2004. Setting up a selective barrier at the apical junction complex. Curr. Opin. Cell Biol. 16140-145. - PubMed
- Balda, M. S., and K. Matter. 2000. Transmembrane proteins of tight junctions. Semin. Cell Dev. Biol. 11281-289. - PubMed
- Barron, D. J., G. Valdimarsson, D. L. Paul, and G. M. Kidder. 1989. Connexin32, a gap junction protein, is a persistent oogenetic product through preimplantation development of the mouse. Dev. Genet. 10318-323. - PubMed
- Becker, D. L., W. H. Evans, C. R. Green, and A. Warner. 1995. Functional analysis of amino acid sequences in connexin43 involved in intercellular communication through gap junctions. J. Cell Sci. 1081455-1467. - PubMed
Publication types
MeSH terms
Substances
LinkOut - more resources
Full Text Sources
Other Literature Sources
Molecular Biology Databases
Miscellaneous

