Adult neurogenesis requires Smad4-mediated bone morphogenic protein signaling in stem cells - PubMed (original) (raw)
Adult neurogenesis requires Smad4-mediated bone morphogenic protein signaling in stem cells
Dilek Colak et al. J Neurosci. 2008.
Abstract
In the mammalian brain, neurogenesis continues only in few regions of the forebrain. The molecular signals governing neurogenesis in these unique neurogenic niches, however, are still ill defined. Here, we show that bone morphogenic protein (BMP)-mediated signaling is active in adult neural stem cells and is crucial to initiate the neurogenic lineage in the adult mouse subependymal zone. Conditional deletion of Smad4 in adult neural stem cells severely impairs neurogenesis, and this is phenocopied by infusion of Noggin, an extracellular antagonist of BMP. Smad4 deletion in stem, but not progenitor cells, as well as Noggin infusion lead to an increased number of Olig2-expressing progeny that migrate to the corpus callosum and differentiate into oligodendrocytes. Transplantation experiments further verified the cell-autonomous nature of this phenotype. Thus, BMP-mediated signaling via Smad4 is required to initiate neurogenesis from adult neural stem cells and suppress the alternative fate of oligodendrogliogenesis.
Figures
Figure 1.
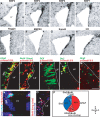
Expression and functional activity of BMP signaling components in the adult SEZ. A–H, In situ hybridization of mRNA transcripts of BMP ligands (A–D), the extracellular inhibitor noggin (E), BMP receptor II (F), the central signaling mediator Smad4 (G), and the downstream target Id3 (H). I–O, Fluorescent micrographs of double immunostainings for the BMP ligand specific phosphorylated Smads 1/5/8 (p-Smad1/5/8) with different cell type-specific antigens in the adult SEZ as indicated in the panels. The arrows in the panels indicate double-labeled cells. Note that p-Smad1/5/8 is contained mostly in GFAP+ (I, N) and some fast proliferating BrdU+ cells (J), but not in DCX+ neuroblasts (K). p-Smad1/5/8 also colocalizes with the transcription factor Dlx2 (L), but not Olig2 (M) (note that there are p-Smad1/5/8+ cells also in the choroid plexus). O, Fluorescent micrograph depicting the colocalization of p-Smad1/5/8 with BrdU in BrdU-retaining cells of the SEZ. The quantitative composition of the p-Smad1/5/8-immunopositive cell pool is depicted in the pie diagram in P. LV, Lateral ventricle; Str, striatum; ChP, choroid plexus. The orientation of the sections is indicated under D, depicting dorsal; V, depicting ventral; R, depicting rostral; and C, depicting caudal. Scale bars: (in H) A–H, 100 μm; (in M) I–O, 70 μm.
Figure 2.
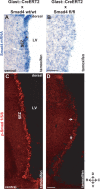
Inducible deletion of Smad4 in adult astrocytes and neural stem cells in the adult SEZ. A, B, In situ hybridization of Smad4 mRNA in the adult SEZ 10 d after activation of CreERT2 expressed in the GLAST locus (GLAST:CreERT2) by tamoxifen in mice without (A) or with (B) exon 8 of Smad4 flanked by loxP sites. Note the loss of Smad4 mRNA in B versus A. C, D, Fluorescent micrographs of p-Smad1/5/8 immunostaining in GLAST:CreERT2 mice WT for the Smad4 locus (C) or homozygous for the floxed exon 8 of Smad4 (D) 10 d after induction of Cre-mediated recombination by tamoxifen. Note the widespread loss of nuclear localization of p-Smad1/5/8 after deletion of Smad4 (D). The arrows in D indicate some of the remaining p-Smad1/5/8+ cells also demonstrating the same quality of immunostaining. LV, Lateral ventricle; D, dorsal; V, ventral; R, rostral; C, caudal. Scale bars: (in B) A, B, 100 μm; (in D) C, D, 100 μm.
Figure 3.
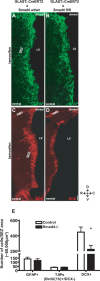
Cell fate analysis after deletion of Smad4 in the adult SEZ. A–D, Fluorescent micrographs depicting GFAP immunostaining for astrocytes and stem cells (A, B) and DCX immunostaining for neuroblasts (C, D) in the adult SEZ 10 d after induction of Cre-mediated recombination. E, Histogram depicting the number of GFAP-immunopositive astrocytes and stem cells [n (cells) = 2922 (control), 2531 (Smad4−/−); 4 animals each], the number of TAPs (BrdU+, DCX−) labeled with BrdU 1 h before kill [n (cells) = 240 (control), 426 (Smad4−/−); 3 animals each] and the number of DCX+ neuroblasts [n (cells) = 11,752 (control), 5400 (Smad4−/−); 4 animals each] 10 d after tamoxifen application. Note the significant reduction of neuroblasts, but not TAPs and GFAP+ cells 10 d after Smad4 deletion. Error bars indicate SEM. *p < 0.05. LV, Lateral ventricle. Scale bar: (in D) A, B, 75 μm; C, D, 100 μm. SEZ area indicates 60,000 μm2 (see also Materials and Methods).
Figure 4.
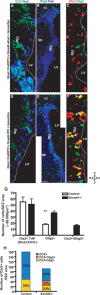
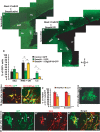
Alteration of transit-amplifying precursor fate on Smad4 deletion. A–F, Fluorescence micrographs depicting DCX and Dlx2 double staining (A, D), Olig2 immunostaining (B, E), and Dlx2/Olig2 double stainings (C, F) (double-positive nuclei are indicated by arrowheads) in the adult SEZ of GLAST:CreERT2 mice without (A–C) or with (D–F) floxed exon 8 of Smad4 10 d after tamoxifen application. G, H, Histograms depicting the number of Dlx2+ TAPs (Dlx2+DCX−) (G) [n (cells) = 652 (control), 562 (Smad4−/−); 3 animals each], the number of Olig2+ cells (G) [n (cells) = 255 (control), 513 (Smad4−/−); 3 animals each], and the number of Olig2- and Dlx2-double-positive cells (G) [n (cells) = 107; 3 animals each] or the number of all Dlx2+ cells (H) [n (cells) = 1430 (control), 834 (Smad4−/−); 3 animals each] with the percentage of DCX− or Olig2+ colocalization in the adult SEZ of GLAST:CreERT2 without (control) or with floxed exon 8 of Smad4 (Smad4−/−) 10 d after tamoxifen application. Note the increase in Olig2 expression in the Dlx2+DCX− population and corresponding decrease in the fraction of Dlx2+DCX+. Error bars indicate SEM. **p < 0.01. The dashed white line in A, C, D, and F depicts the ventricular surface of the SEZ. LV, Lateral ventricle; Str, striatum; D, dorsal; V, ventral; R, rostral; C, caudal. Scale bars: (in E) B–E, 100 μm; (in F) A, C, D, F, 60 μm.
Figure 5.
Smad4 deletion results in increased migration of SEZ-derived cells toward the corpus callosum and the generation of mature oligodendrocytes. A, B, Fluorescent micrographs depicting the location of GFP+ cells 10 d after GFP-virus injection into the SEZ of GLAST:CreERT2 without (A) or with (B) floxed exon 8 of Smad4 10 d after tamoxifen application. The arrowheads indicate GFP+ cells located in the CC. The arrow in B highlights the small number of GFP+ cells remaining in the SEZ after Smad4 deletion. C, Histogram depicting the percentage of GFP+ cells located in the SEZ, RMS, OB, and CC 10 d after injection into the SEZ of GLAST:CreERT2 without [control, n (animals) = 3; n (cells) = 1404] or with floxed exon 8 of Smad4 [Smad4−/−, n (animals) = 3; n (cells) = 440] 10 d after tamoxifen application. Note the increase of GFP-labeled cells in the CC and the corresponding decrease of GFP-labeled cells in the OB on Smad4 deletion. The third bar represents Olig2VP16-GFP injection into SEZ of GLAST:CreERT2 with floxed exon 8 of Smad4 [n (cells) = 528; 2 animals]. Note that the interference with Olig2 function fully rescues the generation of neuroblasts migrating via RMS to the OB in Smad4−/− mice. Error bars indicate SEM. D, E, Fluorescent micrographs of GFP+ cells in CC expressing immature (PDGFRα) (D) and partially mature (CC1 and/or CNPase) (E) oligodendrocyte markers. F, Histogram depicting the proportion of PDGFRα− or CC1− and/or CNPase+ cells among the GFP+ cells labeled in the SEZ that then migrated into the CC. Note that virtually all the increased number of cells migrated into the CC in the Smad4−/− differentiated along the oligodendroglial lineage. G, Fluorescent micrograph depicting the morphology of GFP+ cells in CC 21 d after virus injection in the SEZ of Smad4−/−. H–H″, Fluorescent micrographs of GFP+ cells expressing MOG, one of the mature oligodendrocyte marker, in CC of Smad4−/− mice 30 d after virus injection into the SEZ. The arrows in H–H″ indicate processes positive for both GFP and MOG. *p < 0.05; **p < 0.01. LV, Lateral ventricle; Str, striatum; D, dorsal; V, ventral; R, rostral; C, caudal. Scale bars: (in B) A, B, 100 μm; (in H″) D, G, H–H″, 60 μm; E, 30 μm.
Figure 6.
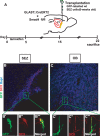
Differentiation of WT cells transplanted into Smad4−/− SEZ. A, Schematic diagram depicting the experimental design of the Venus labeled cells into the SEZ of Glast:CreERT2/Smad4fl/fl animals. B–C″, Fluorescent micrographs depicting localization and DCX expression of GFP-labeled cells 7 d after transplantation in the SEZ (B–B‴) and OB (C–C″). Note that GFP-labeled cells generated DCX+ neuroblasts and were capable of migrating to the OB after transplantation into the SEZ of Smad4−/−. LV, Lateral ventricle. Scale bar: (in C) B, C, 50 μm; B′–C‴, 20 μm.
Figure 7.
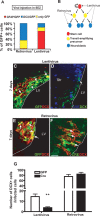
Deletion of Smad4 in stem cells or transit-amplifying cells results in different phenotypes. A, Histogram depicting the identity of GFP-positive cells 2 d after injection of retroviral or lentiviral vectors into the adult SEZ, respectively. Note that retroviral mediated gene transfer occurs only in fast proliferating cells (transit-amplifying precursors and DCX+ neuroblasts), but not in astrocytes and stem cells. The latter are preferentially targeted by lentiviral vectors. B, Lineage diagram depicting viral-specific targeting. C–F, Fluorescent micrographs of GFP+ cells infected with lentiviral (C, D) or retroviral (E, F) vectors double-stained for DCX 7 d after injection. Note that fewer Cre+/DCX+ cells were observed when Cre-containing lentivirus (D), but not Cre-containing retrovirus was used (F). Examples of double-positive cells are indicated by arrows. G, Histogram depicting the number of DCX+ neuroblasts among lentiviral and retroviral infected GFP or Cre+ cells in the adult SEZ of homozygous floxed Smad4 mice 7 d after injection. Note the strong reduction of neuroblasts generated from lentivirus Cre-infected cells, whereas the neuroblast progeny of retrovirus Cre-infected cells was not affected. (Lentivirus: n (animals) = 10; n (cells): GFP = 572, Cre = 830; retrovirus: n (animals) = 6; n (cells): GFP = 372, Cre = 559.) Error bars indicate SEM. **p < 0.01. Scale bar: (in F) C, D, 50 μm; E, F, 40 μm.
Figure 8.
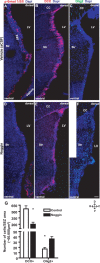
Noggin infusion inhibits adult neurogenesis and upregulates Olig2. A–F, Fluorescent micrographs depicting p-Smad1/5/8+ (A, D), DCX+ (B, E), and Olig2+ (C, F) cells in the SEZ 10 d (7 d infusion plus 3 d survival) after aCSF (A–C) or infusion of the extracellular inhibitor of BMP ligands, Noggin (D–F) into the lateral ventricle of WT mice. Note the loss of nuclear p-Smad1/5/8 staining after Noggin infusion in D compared with control in A. Note the severe reduction in neuroblasts in B and E and, conversely, the increase in the number of Olig2+ cells in C and F after Noggin infusion as depicted in the histogram G [for DCX, n (cells) = 13,516 (vehicle), 4833 (Noggin), 3 animals each; and for Olig2, n (cells) = 168 (vehicle), 332 (Noggin), 3 animals each]. Error bars indicate SEM. *p < 0.05. LV, Lateral ventricle; Str, striatum; D, dorsal; V, ventral; R, rostral; C, caudal. Scale bar: (in F) A, C, D, F, 100 μm; B, E, 120 μm.
Similar articles
- Bone morphogenic protein signaling is a major determinant of dentate development.
Choe Y, Kozlova A, Graf D, Pleasure SJ. Choe Y, et al. J Neurosci. 2013 Apr 17;33(16):6766-75. doi: 10.1523/JNEUROSCI.0128-13.2013. J Neurosci. 2013. PMID: 23595735 Free PMC article. - Bone morphogenetic proteins mediate cellular response and, together with Noggin, regulate astrocyte differentiation after spinal cord injury.
Xiao Q, Du Y, Wu W, Yip HK. Xiao Q, et al. Exp Neurol. 2010 Feb;221(2):353-66. doi: 10.1016/j.expneurol.2009.12.003. Epub 2009 Dec 11. Exp Neurol. 2010. PMID: 20005873 - Noggin expands neural stem cells in the adult hippocampus.
Bonaguidi MA, Peng CY, McGuire T, Falciglia G, Gobeske KT, Czeisler C, Kessler JA. Bonaguidi MA, et al. J Neurosci. 2008 Sep 10;28(37):9194-204. doi: 10.1523/JNEUROSCI.3314-07.2008. J Neurosci. 2008. PMID: 18784300 Free PMC article. - Differentiation of autonomic neurons by BMP-independent mechanisms.
Nakajima T, Ota M, Ito K. Nakajima T, et al. Cell Tissue Res. 2008 Apr;332(1):25-35. doi: 10.1007/s00441-007-0563-7. Epub 2008 Jan 15. Cell Tissue Res. 2008. PMID: 18196275 - BM88 is an early marker of proliferating precursor cells that will differentiate into the neuronal lineage.
Koutmani Y, Hurel C, Patsavoudi E, Hack M, Gotz M, Thomaidou D, Matsas R. Koutmani Y, et al. Eur J Neurosci. 2004 Nov;20(10):2509-23. doi: 10.1111/j.1460-9568.2004.03724.x. Eur J Neurosci. 2004. PMID: 15548196
Cited by
- Adult Neurogenesis and Gliogenesis: Possible Mechanisms for Neurorestoration.
Rusznák Z, Henskens W, Schofield E, Kim WS, Fu Y. Rusznák Z, et al. Exp Neurobiol. 2016 Jun;25(3):103-12. doi: 10.5607/en.2016.25.3.103. Epub 2016 Jun 16. Exp Neurobiol. 2016. PMID: 27358578 Free PMC article. Review. - Meningeal Bmps Regulate Cortical Layer Formation.
Choe Y, Pleasure SJ. Choe Y, et al. Brain Plast. 2018 Dec 26;4(2):169-183. doi: 10.3233/BPL-170048. Brain Plast. 2018. PMID: 30598868 Free PMC article. - The BAF complex interacts with Pax6 in adult neural progenitors to establish a neurogenic cross-regulatory transcriptional network.
Ninkovic J, Steiner-Mezzadri A, Jawerka M, Akinci U, Masserdotti G, Petricca S, Fischer J, von Holst A, Beckers J, Lie CD, Petrik D, Miller E, Tang J, Wu J, Lefebvre V, Demmers J, Eisch A, Metzger D, Crabtree G, Irmler M, Poot R, Götz M. Ninkovic J, et al. Cell Stem Cell. 2013 Oct 3;13(4):403-18. doi: 10.1016/j.stem.2013.07.002. Epub 2013 Aug 8. Cell Stem Cell. 2013. PMID: 23933087 Free PMC article. - Notch and EGFR pathway interaction regulates neural stem cell number and self-renewal.
Aguirre A, Rubio ME, Gallo V. Aguirre A, et al. Nature. 2010 Sep 16;467(7313):323-7. doi: 10.1038/nature09347. Nature. 2010. PMID: 20844536 Free PMC article. - Running-Activated Neural Stem Cells Enhance Subventricular Neurogenesis and Improve Olfactory Behavior in p21 Knockout Mice.
Nicolis di Robilant V, Scardigli R, Strimpakos G, Tirone F, Middei S, Scopa C, De Bardi M, Battistini L, Saraulli D, Farioli Vecchioli S. Nicolis di Robilant V, et al. Mol Neurobiol. 2019 Nov;56(11):7534-7556. doi: 10.1007/s12035-019-1590-6. Epub 2019 May 6. Mol Neurobiol. 2019. PMID: 31062248
References
- Alvarez-Buylla A, Garcia-Verdugo JM, Tramontin AD. A unified hypothesis on the lineage of neural stem cells. Nat Rev Neurosci. 2001;2:287–293. - PubMed
- Attisano L, Wrana JL. Signal transduction by the TGF-beta superfamily. Science. 2002;296:1646–1647. - PubMed
- Berninger B, Guillemot F, Gotz M. Directing neurotransmitter identity of neurones derived from expanded adult neural stem cells. Eur J Neurosci. 2007;25:2581–2590. - PubMed
MeSH terms
Substances
LinkOut - more resources
Full Text Sources
Other Literature Sources
Molecular Biology Databases
Miscellaneous
