Increased MCP-1 and microglia in various regions of the human alcoholic brain - PubMed (original) (raw)
Comparative Study
Increased MCP-1 and microglia in various regions of the human alcoholic brain
Jun He et al. Exp Neurol. 2008 Apr.
Abstract
Cytokines and microglia have been implicated in anxiety, depression, neurodegeneration as well as the regulation of alcohol drinking and other consumatory behaviors, all of which are associated with alcoholism. Studies using animal models of alcoholism suggest that microglia and proinflammatory cytokines contribute to alcoholic pathologies [Crews, F.T., Bechara, R., Brown, L.A., Guidot, D.M., Mandrekar, P., Oak, S., Qin, L., Szabo, G., Wheeler, M., Zou, J., (2006) Cytokines and alcohol. Alcohol., Clin. Exp. Res. 30:720-730]. In the current study, human postmortem brains from moderate drinking controls and alcoholics obtained from the New South Wales Tissue Resource Center were used to study the cytokine, monocyte chemoattractant protein 1 (MCP-1,CCL2) and microglia markers in various brain regions. Since MCP-1 is a key proinflammatory cytokine induced by chronic alcohol treatment of mice, and known to regulate drinking behavior in mice, MCP-1 protein levels from human brain homogenate were measured using ELISA, and indicated increased MCP-1 concentration in ventral tegmental area (VTA), substantia nigra (SN), hippocampus and amygdala of alcoholic brains as compared with controls. Immunohistochemistry was further performed to visualize human microglia using ionized calcium binding adaptor protein-1 (Iba-1), and Glucose transporter-5 (GluT5). Alcoholics were found to have brain region-specific increases in microglial markers. In cingulate cortex, both Iba-1 and GluT5 were increased in alcoholic brains relative to controls. Alternatively, no detectable change was found in amygdala nuclei. In VTA and midbrain, only GluT5, but not Iba-1 was increased in alcoholic brains. These data suggest that the enhanced expression of MCP-1 and microglia activities in alcoholic brains could contribute to ethanol-induced pathogenesis.
Figures
Fig. 1
Increased MCP-1 protein concentrations in alcoholic brains. MCP-1 protein concentrations (pg/mg of total protein) from brain homogenate were measured using ELISA represented as mean ± SEM. Using ANOVA, significantly increased MCP-1 expression was detected in alcoholics as compared to control of in VTA (ventral tegmental area) of alcoholics as compared with controls (*, p<0.05, N=5 controls, N=7 alcoholics), in substantia nigra (SN) (* p<0.05, N=5 controls, N=6 alcoholics), in hippocampus (*, p<0.05, N=6 controls, N=8 alcoholics), and in amygdala (*, p<0.05, N=6 controls, N=8 alcoholics).
Fig.2
Representative pictures of different stages of microglia activation. Ramified microglial cells are believed to be in the resting stage; the bushy-looking microglia indicates early activation; ameboid microglia represent fully activated brain macrophages.
Fig. 3
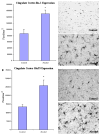
In cingulate cortex, the expression of both Iba-1 and GluT5 was significantly increased in the alcoholic brains (N=5) as compared to the controls (N=4). The level of immunoreactive density was quantified by BioQuant Nova analysis system as described in the Methods and presented as mean ± SEM in pixel/mm2. ANOVA indicated significant differences in immunoreactive density of both Iba-1 and GluT5 between control and alcoholic groups (*, p<0.05).
Fig. 4
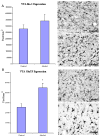
In VTA, the expression of GluT5, but not Iba-1 was significantly higher in the alcoholic brains (N=8) than controls (N=8). The immunoreacitve density was measured by BioQuant Nova analysis system as described in the Methods and presented as mean ± SEM in pixel/mm2. ANOVA indicated a significant increase in GluT5 immunoreactivity, but not Iba-1, in alcoholics as compared to controls (*, p<0.05).
Fig. 5
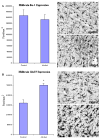
In Midbrain, the expression of GluT5, but not Iba-1 was significantly higher in the alcoholic brains (N=6) as compared to controls (N=5). The immunoreactive density was measured by BioQuant Nova analysis system as described in the Methods and presented as mean ± SEM in pixel/mm2. ANOVA indicated a significant increase in GluT5 immunoreactivity, but not Iba-1, in alcoholics as compared to controls (*, p<0.05).
Fig. 6
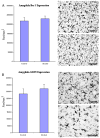
In Amygdala, no significant difference was detected in either Iba-1 or GluT5 expression between alcoholic (N=8) and control brains (N=8). The immunoreactive density measured by BioQuant Nova systems as described in the Methods and presented as mean ± SEM in pixel/mm2. ANOVA indicated no significant differences in either marker between alcoholic and control groups.
Comment in
- Neuroinflammation as a neurotoxic mechanism in alcoholism: commentary on "Increased MCP-1 and microglia in various regions of human alcoholic brain".
Sullivan EV, Zahr NM. Sullivan EV, et al. Exp Neurol. 2008 Sep;213(1):10-7. doi: 10.1016/j.expneurol.2008.05.016. Epub 2008 Jul 14. Exp Neurol. 2008. PMID: 18625499 Free PMC article. Review. No abstract available.
Similar articles
- Role of MCP-1 and CCR2 in ethanol-induced neuroinflammation and neurodegeneration in the developing brain.
Zhang K, Wang H, Xu M, Frank JA, Luo J. Zhang K, et al. J Neuroinflammation. 2018 Jul 5;15(1):197. doi: 10.1186/s12974-018-1241-2. J Neuroinflammation. 2018. PMID: 29976212 Free PMC article. - Time course of microglia activation and brain and blood cytokine/chemokine levels following chronic ethanol exposure and protracted withdrawal in rats.
Sanchez-Alavez M, Nguyen W, Mori S, Wills DN, Otero D, Ehlers CL, Conti B. Sanchez-Alavez M, et al. Alcohol. 2019 May;76:37-45. doi: 10.1016/j.alcohol.2018.07.005. Epub 2018 Jul 17. Alcohol. 2019. PMID: 30554034 Free PMC article. - Cellular GABAergic Neuroactive Steroid (3α,5α)-3-Hydroxy-Pregnan-20-One (3α,5α-THP) Immunostaining Levels Are Increased in the Ventral Tegmental Area of Human Alcohol Use Disorder Patients: A Postmortem Study.
Hasirci AS, Maldonado-Devincci AM, Beattie MC, O'Buckley TK, Morrow AL. Hasirci AS, et al. Alcohol Clin Exp Res. 2017 Feb;41(2):299-311. doi: 10.1111/acer.13300. Epub 2017 Jan 9. Alcohol Clin Exp Res. 2017. PMID: 28068457 Free PMC article. - Role of MCP-1 and CCR2 in alcohol neurotoxicity.
Zhang K, Luo J. Zhang K, et al. Pharmacol Res. 2019 Jan;139:360-366. doi: 10.1016/j.phrs.2018.11.030. Epub 2018 Nov 22. Pharmacol Res. 2019. PMID: 30472461 Free PMC article. Review. - Role of microglia in ethanol-induced neurodegenerative disease: Pathological and behavioral dysfunction at different developmental stages.
Yang JY, Xue X, Tian H, Wang XX, Dong YX, Wang F, Zhao YN, Yao XC, Cui W, Wu CF. Yang JY, et al. Pharmacol Ther. 2014 Dec;144(3):321-37. doi: 10.1016/j.pharmthera.2014.07.002. Epub 2014 Jul 10. Pharmacol Ther. 2014. PMID: 25017304 Review.
Cited by
- An exploratory study of pro-inflammatory cytokines in individuals with alcohol use disorder: MCP-1 and IL-8 associated with alcohol consumption, sleep quality, anxiety, depression, and liver biomarkers.
Kazmi N, Wallen GR, Yang L, Alkhatib J, Schwandt ML, Feng D, Gao B, Diazgranados N, Ramchandani VA, Barb JJ. Kazmi N, et al. Front Psychiatry. 2022 Aug 11;13:931280. doi: 10.3389/fpsyt.2022.931280. eCollection 2022. Front Psychiatry. 2022. PMID: 36032219 Free PMC article. - Ethanol-Induced Neurodegeneration and Glial Activation in the Developing Brain.
Saito M, Chakraborty G, Hui M, Masiello K, Saito M. Saito M, et al. Brain Sci. 2016 Aug 16;6(3):31. doi: 10.3390/brainsci6030031. Brain Sci. 2016. PMID: 27537918 Free PMC article. Review. - Immune function genes, genetics, and the neurobiology of addiction.
Crews FT. Crews FT. Alcohol Res. 2012;34(3):355-61. Alcohol Res. 2012. PMID: 23134052 Free PMC article. - Unveiling Sex-Based Differences in the Effects of Alcohol Abuse: A Comprehensive Functional Meta-Analysis of Transcriptomic Studies.
Casanova Ferrer F, Pascual M, Hidalgo MR, Malmierca-Merlo P, Guerri C, García-García F. Casanova Ferrer F, et al. Genes (Basel). 2020 Sep 21;11(9):1106. doi: 10.3390/genes11091106. Genes (Basel). 2020. PMID: 32967293 Free PMC article. - Deep sequencing and miRNA profiles in alcohol-induced neuroinflammation and the TLR4 response in mice cerebral cortex.
Ureña-Peralta JR, Alfonso-Loeches S, Cuesta-Diaz CM, García-García F, Guerri C. Ureña-Peralta JR, et al. Sci Rep. 2018 Oct 29;8(1):15913. doi: 10.1038/s41598-018-34277-y. Sci Rep. 2018. PMID: 30374194 Free PMC article.
References
- Banisadr G, Queraud-Lesaux F, Boutterin MC, Pelaprat D, Zalc B, Rostene W, Haour F, Parsadaniantz SM. Distribution, cellular localization and functional role of CCR2 chemokine receptors in adult rat brain. J Neurochem. 2002;81:257–269. - PubMed
- Barger SW, Harmon AD. Microglial activation by Alzheimer amyloid precursor protein and modulation by apolipoprotein E. Nature. 1997;388:878–881. - PubMed
- Block ML, Zecca L, Hong JS. Microglia-mediated neurotoxicity: uncovering the molecular mechanisms. Nat Rev Neurosci. 2007;8:57–69. - PubMed
- Brooks PJ. Brain atrophy and neuronal loss in alcoholism: a role for DNA damage? Neurochem Int. 2000;37:403–412. - PubMed
Publication types
MeSH terms
Substances
Grants and funding
- P60 AA011605/AA/NIAAA NIH HHS/United States
- R01 AA006069/AA/NIAAA NIH HHS/United States
- R24 AA012725/AA/NIAAA NIH HHS/United States
- R28 AA012725/AA/NIAAA NIH HHS/United States
LinkOut - more resources
Full Text Sources
Other Literature Sources
Medical
Research Materials
Miscellaneous


