XMAP215 is a processive microtubule polymerase - PubMed (original) (raw)
XMAP215 is a processive microtubule polymerase
Gary J Brouhard et al. Cell. 2008.
Abstract
Fast growth of microtubules is essential for rapid assembly of the microtubule cytoskeleton during cell proliferation and differentiation. XMAP215 belongs to a conserved family of proteins that promote microtubule growth. To determine how XMAP215 accelerates growth, we developed a single-molecule assay to visualize directly XMAP215-GFP interacting with dynamic microtubules. XMAP215 binds free tubulin in a 1:1 complex that interacts with the microtubule lattice and targets the ends by a diffusion-facilitated mechanism. XMAP215 persists at the plus end for many rounds of tubulin subunit addition in a form of "tip tracking." These results show that XMAP215 is a processive polymerase that directly catalyzes the addition of up to 25 tubulin dimers to the growing plus end. Under some circumstances XMAP215 can also catalyze the reverse reaction, namely microtubule shrinkage. The similarities between XMAP215 and formins, actin polymerases, suggest that processive tip tracking is a common mechanism for stimulating the growth of cytoskeletal polymers.
Figures
Figure 1. XMAP215 promotes microtubule growth and binds plus ends
(A) Schematic of the in vitro assay depicting a seed microtubule (red) immobilized above a cover glass surface by anti-rhodamine antibodies (dark blue). Two proteins are introduced, XMAP215 and tubulin (not shown). Polymerization occurs, resulting in the growth of a dynamic microtubule from the seed microtubule. Either the XMAP215 or the tubulin carries a fluorescent tag (see Methods). Excitation by total internal reflection can allow the detection of single molecules in the evanescent field (see, e.g., Figures 2C and 2E, below). The schematic is not to scale. (B) (top) Still image of a seed microtubule (red) with a dynamic microtubule lattice growing from the plus end (green) in the presence of 100 nM XMAP215. (bottom) Kymograph of the microtubule above, corresponding to Supplementary Movie 1. Two periods of growth (rate = 3 _μ_m·min-1) and two catastrophes are visible within the kymograph. (C) Plot of microtubule growth rate vs. XMAP215 concentration for XMAP215 and XMAP215-GFP. Data were fitted to the Hill equation (line drawn). Error bars represent the SEM (n ≥ 9).
Figure 2. XMAP215 at dynamic microtubule ends
(A) Kymograph of XMAP215-GFP molecules (50 nM) associated with a plus end during growth by “tip-tracking.” The seed microtubule is shown in red and XMAP215-GFP is shown in green. Taken from time-lapse microscopy. (B) Kymograph depicting XMAP215-GFP (green) associated with the plus end of a dynamic lattice during shrinkage following a catastrophe. (C) Kymograph from a spike experiment, showing single XMAP215-GFP molecules (green) associating with a dynamic plus end (yellow arrows) and diffusing on freshly polymerized lattice (white arrows). Taken from streaming video. The white arrow at right illustrates the outward displacement of the XMAP215-GFP molecules. (D) Histogram of durations of single XMAP215-GFP end residence events. An exponential curve fit (red line) corrected for photobleaching gives a mean end residence time, 〈_t_END〉, of 3.8 ± 0.7 s. (E) Still series of a single XMAP215-GFP molecule moving with the microtubule plus end during growth. (F) Plot of the mean displacement of XMAP215-GFP end-residence events versus time. Data were fitted to a line, the slope of which gives the velocity of outward displacement. Error bars represent the SEM (n = 198).
Figure 3. XMAP215 forms a complex with tubulin
(A) Plot of A280 absorbance against elution volume from the size exclusion chromatography experiments. 3 traces are shown: tubulin alone (red), XMAP215 alone (green), and a complex of XMAP215 + one tubulin dimer (blue). (B) Intensity scan of an SDS-PAGE gel taken from the above experiment. Lanes correspond to samples selected from the elution profile. (C-D) Electron micrographs of negatively stained complexes of XMAP215 and tubulin. The panels on the right are at 2× magnification. Scale bars 50 nm. (C) XMAP215 monomer. (D) XMAP215:tubulin complex. The XMAP215:tubulin complex has a sedimentation coefficient indicative of an elongated molecule (see Supplementary Info 4.2), indicating that the C-terminus of XMAP215 may extend from the complex. Hints of the C-terminal extension are evident. (E) Schematic showing XMAP215 with 5 TOG domains enclosing a single tubulin dimer to form a 1:1 complex. TOG domains are represented by light blue boxes. The contour lengths of XMAP215 and the tubulin dimer are approximately to scale. The arrangement of the TOG domains in the complex with tubulin is not known.
Figure 4. XMAP215 targets one tubulin to the microtubule end by lattice diffusion
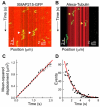
(A) Kymograph depicting the diffusion of XMAP215-GFP alone on a GMPCPP microtubule (white arrows). (B) Kymograph depicting the XMAP215:tubulin complex diffusing on the microtubule (yellow arrows). Note the similarity to (A). (C) Plot of mean-squared displacement versus time for XMAP215-GFP against the time interval over which it was measured. A linear curve fit to the data yields a diffusion coefficient, D, of 0.3 ± 0.01 _μ_m2·s-1. Error bars are the SEM of the squared displacement values (n = 1383). (D) Histogram of durations of XMAP215-GFP microtubule interactions. An exponential curve fit, corrected for photobleaching, yields a mean lifetime of the interactions, 〈_t_〉, of 2.45 ± 0.21 s.
Figure 5. XMAP215 catalyzes both growth and shrinkage
(A) Kymograph of a single microtubule exposed to 3 tubulin concentrations at 100 nM XMAP215, corresponding to Supplementary Movie 4. At 0 _μ_M GTP-tubulin, the GMPCPP microtubule seed depolymerized (top). At 0.1 _μ_M GTP-tubulin, the depolymerization was inhibited (middle), and at 5 _μ_M GTP-tubulin, rapid microtubule growth occurred (bottom). (B) Plot of the depolymerization rate against XMAP215 concentration at two tubulin concentrations. Error bars represent the SEM (n ≥ 9). The data were fitted to the Hill equation (lines plotted). At 0.1 _μ_M GTP-tubulin, depolymerization was inhibited.
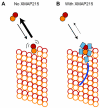
Figure 6. Model diagram for tubulin polymerization by XMAP215
(A) Schematic of the plus end of a microtubule (hollow circles). A weakly-attached tubulin is shown in full color. Tubulin dimers collide with the microtubule end in a diffusion-limited reaction (arrow pointing to microtubule), but these collision-complexes are short-lived, and the tubulin dimer often diffuses away (bold arrow pointing to solution). (B) XMAP215 stabilizes the weakly-attached tubulin dimer, so that a larger fraction incorporate into the microtubule (small arrow pointing to solution). Note that the collision complex forms at the same rate with or without XMAP215.
Comment in
- XMAP215: a tip tracker that really moves.
Asbury CL. Asbury CL. Cell. 2008 Jan 11;132(1):19-20. doi: 10.1016/j.cell.2007.12.019. Cell. 2008. PMID: 18191214 Free PMC article. Review.
Similar articles
- XMAP215: a tip tracker that really moves.
Asbury CL. Asbury CL. Cell. 2008 Jan 11;132(1):19-20. doi: 10.1016/j.cell.2007.12.019. Cell. 2008. PMID: 18191214 Free PMC article. Review. - The role of TOG domains in microtubule plus end dynamics.
Slep KC. Slep KC. Biochem Soc Trans. 2009 Oct;37(Pt 5):1002-6. doi: 10.1042/BST0371002. Biochem Soc Trans. 2009. PMID: 19754440 Review. - Stu2p, the budding yeast member of the conserved Dis1/XMAP215 family of microtubule-associated proteins is a plus end-binding microtubule destabilizer.
van Breugel M, Drechsel D, Hyman A. van Breugel M, et al. J Cell Biol. 2003 Apr 28;161(2):359-69. doi: 10.1083/jcb.200211097. J Cell Biol. 2003. PMID: 12719475 Free PMC article. - XMAP215 is a long thin molecule that does not increase microtubule stiffness.
Cassimeris L, Gard D, Tran PT, Erickson HP. Cassimeris L, et al. J Cell Sci. 2001 Aug;114(Pt 16):3025-33. doi: 10.1242/jcs.114.16.3025. J Cell Sci. 2001. PMID: 11686305 - XMAP215 is a microtubule nucleation factor that functions synergistically with the γ-tubulin ring complex.
Thawani A, Kadzik RS, Petry S. Thawani A, et al. Nat Cell Biol. 2018 May;20(5):575-585. doi: 10.1038/s41556-018-0091-6. Epub 2018 Apr 25. Nat Cell Biol. 2018. PMID: 29695792 Free PMC article.
Cited by
- Axon injury and stress trigger a microtubule-based neuroprotective pathway.
Chen L, Stone MC, Tao J, Rolls MM. Chen L, et al. Proc Natl Acad Sci U S A. 2012 Jul 17;109(29):11842-7. doi: 10.1073/pnas.1121180109. Epub 2012 Jun 25. Proc Natl Acad Sci U S A. 2012. PMID: 22733771 Free PMC article. - A phenotypic screen identifies microtubule plus end assembly regulators that can function in mitotic spindle orientation.
Stolz A, Ertych N, Bastians H. Stolz A, et al. Cell Cycle. 2015;14(6):827-37. doi: 10.1080/15384101.2014.1000693. Cell Cycle. 2015. PMID: 25590964 Free PMC article. - To nucleate or not, that is the question in neurons.
Weiner AT, Thyagarajan P, Shen Y, Rolls MM. Weiner AT, et al. Neurosci Lett. 2021 Apr 23;751:135806. doi: 10.1016/j.neulet.2021.135806. Epub 2021 Mar 8. Neurosci Lett. 2021. PMID: 33705928 Free PMC article. Review. - CKAP5 stabilizes CENP-E at kinetochores by regulating microtubule-chromosome attachments.
Lakshmi RB, Nayak P, Raz L, Sarkar A, Saroha A, Kumari P, Nair VM, Kombarakkaran DP, Sajana S, M G S, Agasti SS, Paul R, Ben-David U, Manna TK. Lakshmi RB, et al. EMBO Rep. 2024 Apr;25(4):1909-1935. doi: 10.1038/s44319-024-00106-9. Epub 2024 Feb 29. EMBO Rep. 2024. PMID: 38424231 Free PMC article. - Kinetochores generate microtubules with distal plus ends: their roles and limited lifetime in mitosis.
Kitamura E, Tanaka K, Komoto S, Kitamura Y, Antony C, Tanaka TU. Kitamura E, et al. Dev Cell. 2010 Feb 16;18(2):248-59. doi: 10.1016/j.devcel.2009.12.018. Dev Cell. 2010. PMID: 20159595 Free PMC article.
References
- Al-Bassam J, Larsen NA, Hyman AA, Harrison SC. Crystal structure of a TOG domain: conserved features of XMAP215/Dis1-family TOG domains and implications for tubulin binding. Structure. 2007;15:355–362. - PubMed
- Ashford AJ, Anderson SSL, Hyman AA. Cell Biology: A Laboratory Handbook. Academic Press; San Diego: 1998. Preparation of tubulin from bovine brain; pp. 205–212.
Publication types
MeSH terms
Substances
Grants and funding
- F32 GM074723-01A1/GM/NIGMS NIH HHS/United States
- R01 AR040593-10/AR/NIAMS NIH HHS/United States
- R01 AR040593/AR/NIAMS NIH HHS/United States
- F32 GM078023-01/GM/NIGMS NIH HHS/United States
- R01 AR40593/AR/NIAMS NIH HHS/United States
LinkOut - more resources
Full Text Sources
Other Literature Sources


