Innocuous IFNgamma induced by adjuvant-free antigen restores normoglycemia in NOD mice through inhibition of IL-17 production - PubMed (original) (raw)
Innocuous IFNgamma induced by adjuvant-free antigen restores normoglycemia in NOD mice through inhibition of IL-17 production
Renu Jain et al. J Exp Med. 2008.
Abstract
The role of Th17 cells in type I diabetes (TID) remains largely unknown. Glutamic acid decarboxylase (GAD) sequence 206-220 (designated GAD2) represents a late-stage epitope, but GAD2-specific T cell receptor transgenic T cells producing interferon gamma (IFNgamma) protect against passive TID. Because IFNgamma is known to inhibit Th17 cells, effective presentation of GAD2 peptide under noninflammatory conditions may protect against TID at advanced disease stages. To test this premise, GAD2 was genetically incorporated into an immunoglobulin (Ig) molecule to magnify tolerance, and the resulting Ig-GAD2 was tested against TID at different stages of the disease. The findings indicated that Ig-GAD2 could not prevent TID at the preinsulitis phase, but delayed TID at the insulitis stage. More importantly, Ig-GAD2 sustained both clearance of pancreatic cell infiltration and beta-cell division and restored normoglycemia when given to hyperglycemic mice at the prediabetic stage. This was dependent on the induction of splenic IFNgamma that inhibited interleukin (IL)-17 production. In fact, neutralization of IFNgamma led to a significant increase in the frequency of Th17 cells, and the treatment became nonprotective. Thus, IFNgamma induced by an adjuvant free antigen, contrary to its usual inflammatory function, restores normoglycemia, most likely by localized bystander suppression of pathogenic IL-17-producing cells.
Figures
Figure 1.
Ig-GAD2 treatment given at the insulitis-positive stage reverses T1D. (A and B) Presentation of Ig-GAD2 to T cells. NOD splenic APCs were incubated with free peptides (A) or Ig chimeras (B), and 1 h later GAD2-specific T cells were added. Activation was assessed by [3H]thymidine incorporation. HEL peptide and Ig-HEL were included as negative controls. (C and D) Percentage of mice free of diabetes upon treatment with Ig-GAD2 or the control Ig-HEL at the preinsulitis (C) and insulitis (D) stage, respectively. All mice were monitored for blood glucose from 12 to 30 wk of age. *, P < 0.05; **, P < 0.01 compared with untreated mice. A mouse is considered diabetic when blood glucose level is ≥ 300 mg/dl for two consecutive weeks. An untreated group was included in all experiments for comparison purposes. At least 10 mice were included in each experimental group.
Figure 2.
Ig-GAD2 treatment given at the prediabetic stage reverses T1D. (A and B) Percentage of mice free of diabetes upon treatment with Ig-GAD2 or the control Ig-HEL at the hyperglycemic stage for 15 (A) or 25 wk (B). Arrows indicate the beginning and end of treatment. (C and D) Individual blood glucose levels of Ig-GAD2 treated mice are shown from the week of diagnosis of hyperglycemia up to 52 or 56 wk of age for 15 (C) and 25 wk (D) treatment regimens. Each dot represents a different mouse. A mouse is considered hyperglycemic or diabetic when blood glucose level is between 160–250 or ≥ 300 mg/dl for two consecutive weeks, respectively. The shaded area indicates the hyperglycemic range of blood glucose levels and the line depicts the diabetic level. An untreated group was included in all experiments for comparison purposes. At least 10 mice were included in each experimental group.
Figure 3.
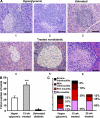
Ig-GAD2 treatment diminishes insulitis and increases the total number of islets. (A) Pancreatic histology. Four sections per pancreas (8 μm thick each cut 100 μm apart) from 5 hyperglycemic (A, 1 and 2), untreated diabetic (A, 3) or 15-wk Ig-GAD2–treated nondiabetic (A, 4, 5, and 6) mice were stained with hematoxylin and eosin and analyzed at 400× magnification. For the hyperglycemic and untreated diabetic mice sections were made the second week of diagnosis. For the treated nondiabetic mice, histology was performed 7 wk after the last treatment. (B) Total islets per pancreas as determined by hematoxylin and eosin staining from the three groups of mice described in A. Only structures with visible islet cells and incomplete infiltration were counted. (C) Islets from hyperglycemic, 15 and 25 wk Ig-GAD2–treated mice were scored as described in Materials and methods, and the percentages represent the number of islets of a given score over the total number of islets from B. The sections were made at the time indicated in A, and 2 d after the last Ig-GAD2 injection for the 25 wk–treated group. ***, P = 0.0001 for the total number of islets in 15 wk–treated versus hyperglycemic group. Error bars indicate the SD. Bars, 25 μm.
Figure 4.
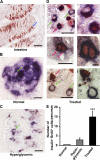
β Cells from mice treated with Ig-GAD2 incorporate BrdU. Mice (10 per group) were given 100 mg/kg BrdU i.p. and killed 3 h later. Sections of the small intestine or pancreas were stained with anti-insulin and -BrdU antibodies, and then analyzed for insulin production (blue cytoplasmic rim) and BrdU incorporation (red nuclei) at 400× magnification. Blue arrows indicate BrdU+ cells, green arrows indicate insulin+ cells, and red arrows indicate BrdU+/insulin+ cells. Intestinal lumen (A) and β cells (D) from mice recipient of the 25-wk Ig-GAD2 regimen. (B) Beta cells from 5-wk-old nondiabetic NOD mice. (C) β Cells from hyperglycemic mice. (E) Total number of insulin+/BrdU+ cells in nondiabetic (normal), hyperglycemic, and Ig-GAD2–treated nondiabetic NOD mice. ***, P = 0.0001, treated group compared with hyperglycemic group. Error bars indicate the SD of 10 pancreata. Bars: (A–C) 25 μm; (D, left) 20 μm; (D, right) 5 μm D.
Figure 5.
Treatment with Ig-GAD2 induces IFNγ that sustains protection against diabetes. (A) Splenocytes from hyperglycemic mice recipient of the 25-wk Ig-GAD2 treatment regimen were stimulated in vitro with GAD2 and the control HEL peptide and IFNγ and IL-10 were measured by ELISA as described in Methods. Diabetic as well as untreated hyperglycemic mice were included for control purposes. Each bar represents the mean ± SD of three independent experiments. *, P = 0.01 when stimulation by GAD2 is compared with HEL peptide. (B) Intracellular IL-10 and IFNγ production by splenic CD4 (top) or Vβ8.1/8.2 (bottom) T cells from the 25-wk–treated (right) and hyperglycemic untreated (left) mice. This was done by intracellular staining upon stimulation with GAD2 peptide, as indicated in the Materials and methods. Data are representative of three independent experiments. (C) Percentage of mice free of diabetes upon in vivo neutralization of IFNγ (left) or IL-10 (right) during treatment with Ig-GAD2 at the hyperglycemic stage. Anti-IFNγ (R4-6A4), anti-IL-10 (JES5-2A5), or isotype control rat IgG were given to mice (500 μg/mouse per injection) i.p. every 3 d for 4 consecutive weeks, beginning with the first injection of Ig chimeras. The mice received a total of nine antibody injections. At least eight mice were included in each experimental group.
Figure 6.
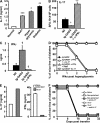
Neutralization of IFNγ during treatment with Ig-GAD2 restores IL-17 production. (A) IL-17 response from the splenocytes of preinsulitis (normal), insulitis-positive (IAA+), hyperglycemic, and diabetic mice upon in vitro stimulation with anti-CD3 antibody. Data are representative of three independent experiments. ***, P = 0.0004, insulitis-positive versus normal; *, P = 0.02, hyperglycemic versus insulitis-positive; **, P = 0.005, diabetic versus hyperglycemic group. IL-17 (B) and IFNγ (C) response from splenocytes of mice recipient of anti-IFNγ during treatment with Ig-GAD2 at the hyperglycemic stage. Splenocytes were harvested when the mice became diabetic on the fourth week of treatment; they were stimulated in vitro with GAD2 peptide, and their responses were measured by ELISPOT and ELISA, respectively. Nil (diabetic) and Ig-GAD2–treated groups were included as controls. Data are representative of three independent experiments. †, P = 0.01, treated versus nil group; ††, P = 0.001, Ig-GAD2 + anti-IFNγ versus Ig-GAD2 group. †, P = 0.04, Ig-GAD2 versus nil group; †, P = 0.02, Ig-GAD2 + anti-IFNγ versus Ig-GAD2 group. (D) Percentage of mice free of diabetes upon administration of recombinant IL-17 or neutralization of both IFNγ and IL-17 during treatment with Ig-GAD2 at the hyperglycemic stage. IL-17 was administered (1 μg/mouse per injection) i.p. daily for 5 consecutive days, beginning with the first injection of Ig-GAD2. Subsequently, the mice received an injection of rIL-17 every week, along with Ig-GAD2. An injection of anti-IFNγ (R4-6A4; 500 μg/mouse) and anti-IL-17 (TC11-18H10; 200 μg/mouse) was given on the first day of treatment with Ig-GAD2 after diagnosis of hyperglycemia. Four additional injections were given at 4-d intervals. At least eight mice were included in each experimental group. (E and F) Th17-polarized cells induce diabetes. (E) IL-17 (left) and IFNγ (right) responses from the nonpolarized and Th17 polarized splenocytes were measured by ELISA. Each bar represents the mean ± SD of triplicate wells. (F) Percentage of mice free of diabetes upon adoptive transfer of 10 × 106 naive, nonpolarized and Th17-polarized cells in NOD.scids (4–6 wk old). Additional groups received IL-17 neutralizing antibody, along with Th17-polarized and nonpolarized cells for control purposes. Anti–IL-17 antibody (TC11-18H10; 200 μg/mouse) was given on the day of transfer, and two additional injections were given at day 4 and 16 after transfer.
Figure 7.
Splenic IFNγ induced by Ig-GAD2 treatment diminishes splenic and pancreatic IL-17 causing reversal of diabetes. IFNγ and IL-17 cytokine responses of splenic, pancreatic, and pancreatic lymph node cells from mice treated with Ig-GAD2 for 1 wk (A and B) or 25 wk (C and D) starting from the week of hyperglycemia diagnosis. The cells were stimulated with GAD2 peptide, and the responses were measured by ELISA for IFNγ and ELISPOT for IL-17, as indicated in Materials and methods. Each bar represents the mean ± SD of two independent experiments.
Similar articles
- IFN-γ induced by IL-12 administration prevents diabetes by inhibiting pathogenic IL-17 production in NOD mice.
Zhang J, Huang Z, Sun R, Tian Z, Wei H. Zhang J, et al. J Autoimmun. 2012 Feb;38(1):20-8. doi: 10.1016/j.jaut.2011.11.017. Epub 2011 Dec 18. J Autoimmun. 2012. PMID: 22186068 - B7-H4.Ig inhibits the development of type 1 diabetes by regulating Th17 cells in NOD mice.
Lee IF, Wang X, Hao J, Akhoundsadegh N, Chen L, Liu L, Langermann S, Ou D, Warnock GL. Lee IF, et al. Cell Immunol. 2013 Mar;282(1):1-8. doi: 10.1016/j.cellimm.2013.03.005. Epub 2013 Apr 4. Cell Immunol. 2013. PMID: 23623902 - All-trans retinoic acid inhibits type 1 diabetes by T regulatory (Treg)-dependent suppression of interferon-gamma-producing T-cells without affecting Th17 cells.
Van YH, Lee WH, Ortiz S, Lee MH, Qin HJ, Liu CP. Van YH, et al. Diabetes. 2009 Jan;58(1):146-55. doi: 10.2337/db08-1154. Epub 2008 Nov 4. Diabetes. 2009. PMID: 18984738 Free PMC article. - Dendritic cell-expanded, islet-specific CD4+ CD25+ CD62L+ regulatory T cells restore normoglycemia in diabetic NOD mice.
Tarbell KV, Petit L, Zuo X, Toy P, Luo X, Mqadmi A, Yang H, Suthanthiran M, Mojsov S, Steinman RM. Tarbell KV, et al. J Exp Med. 2007 Jan 22;204(1):191-201. doi: 10.1084/jem.20061631. Epub 2007 Jan 8. J Exp Med. 2007. PMID: 17210729 Free PMC article. - Intramuscular administration of expression plasmids encoding interferon-gamma receptor/IgG1 or IL-4/IgG1 chimeric proteins protects from autoimmunity.
Chang Y, Prud'homme GJ. Chang Y, et al. J Gene Med. 1999 Nov-Dec;1(6):415-23. doi: 10.1002/(SICI)1521-2254(199911/12)1:6<415::AID-JGM66>3.0.CO;2-B. J Gene Med. 1999. PMID: 10753067
Cited by
- Formation of pancreatic β-cells from precursor cells contributes to the reversal of established type 1 diabetes.
Ukah TK, Cattin-Roy AN, Davis GE, Zaghouani H. Ukah TK, et al. Cell Immunol. 2021 Jun;364:104360. doi: 10.1016/j.cellimm.2021.104360. Epub 2021 Apr 9. Cell Immunol. 2021. PMID: 33866285 Free PMC article. - No evidence for activation of T(H)1 or T(H)17 pathways in unstimulated peripheral blood mononuclear cells from children with β-cell autoimmunity or T1D.
Walldén J, Honkanen J, Ilonen J, Ludvigsson J, Vaarala O. Walldén J, et al. J Inflamm Res. 2008;1:11-7. doi: 10.2147/jir.s3547. Epub 2008 Sep 1. J Inflamm Res. 2008. PMID: 22096343 Free PMC article. - Differential IL-21 signaling in APCs leads to disparate Th17 differentiation in diabetes-susceptible NOD and diabetes-resistant NOD.Idd3 mice.
Liu SM, Lee DH, Sullivan JM, Chung D, Jäger A, Shum BO, Sarvetnick NE, Anderson AC, Kuchroo VK. Liu SM, et al. J Clin Invest. 2011 Nov;121(11):4303-10. doi: 10.1172/JCI46187. Epub 2011 Oct 24. J Clin Invest. 2011. PMID: 22019586 Free PMC article. - Can childhood viral infection protect from type 1 diabetes?
Strom TB. Strom TB. J Clin Invest. 2009 Jun;119(6):1458-61. doi: 10.1172/jci39565. J Clin Invest. 2009. PMID: 19504721 Free PMC article. - Th17 cells promote pancreatic inflammation but only induce diabetes efficiently in lymphopenic hosts after conversion into Th1 cells.
Martin-Orozco N, Chung Y, Chang SH, Wang YH, Dong C. Martin-Orozco N, et al. Eur J Immunol. 2009 Jan;39(1):216-24. doi: 10.1002/eji.200838475. Eur J Immunol. 2009. PMID: 19130584 Free PMC article.
References
- Shoda, L.K., D.L. Young, S. Ramanujan, C.C. Whiting, M.A. Atkinson, J.A. Bluestone, G.S. Eisenbarth, D. Mathis, A.A. Rossini, S.E. Campbell, et al. 2005. A comprehensive review of interventions in the NOD mouse and implications for translation. Immunity. 23:115–126. - PubMed
- Tisch, R., and H. McDevitt. 1996. Insulin-dependent diabetes mellitus. Cell. 85:291–297. - PubMed
- Bach, J.F. 1994. Insulin-dependent diabetes mellitus as an autoimmune disease. Endocr. Rev. 15:516–542. - PubMed
Publication types
MeSH terms
Substances
Grants and funding
- R01 DK065748/DK/NIDDK NIH HHS/United States
- R21 AI068746/AI/NIAID NIH HHS/United States
- R01 DK65748/DK/NIDDK NIH HHS/United States
- R21AI68746/AI/NIAID NIH HHS/United States
LinkOut - more resources
Full Text Sources
Other Literature Sources
Medical


