Development of all CD4 T lineages requires nuclear factor TOX - PubMed (original) (raw)
Development of all CD4 T lineages requires nuclear factor TOX
Parinaz Aliahmad et al. J Exp Med. 2008.
Abstract
CD8(+) cytotoxic and CD4(+) helper/inducer T cells develop from common thymocyte precursors that express both CD4 and CD8 molecules. Upon T cell receptor signaling, these cells initiate a differentiation program that includes complex changes in CD4 and CD8 expression, allowing identification of transitional intermediates in this developmental pathway. Little is known about regulation of these early transitions or their specific importance to CD4 and CD8 T cell development. Here, we show a severe block at the CD4(lo)CD8(lo) transitional stage of positive selection caused by loss of the nuclear HMG box protein TOX. As a result, CD4 lineage T cells, including regulatory T and CD1d-dependent natural killer T cells, fail to develop. In contrast, functional CD8(+) T cells develop in TOX-deficient mice. Our data suggest that TOX-dependent transition to the CD4(+)CD8(lo) stage is required for continued development of class II major histocompatibility complex-specific T cells, regardless of ultimate lineage fate.
Figures
Figure 1.
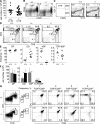
Generation of Tox−/− mice. (A) Schematic of gene-targeting strategy to delete genomic region surrounding exon 1 of the Tox gene. The location of loxP sites (triangles), exon 1 (black box), transcription start sites (ATG; large arrows), and genomic PCR primers (small arrows) is shown. Location and direction of selectable marker gene cassettes encoding thymidine kinase (HSVTk) and neomycin resistance (PGKneo) are also depicted. Restriction enzymes sites in Tox are indicated. H, HindIII; Nh, NheI; N, NcoI; B, BglII. (B) Genomic PCR for Tox in total thymocytes from Tox+/+ (+/+), Tox+/− (+/−), and Tox−/− (−/−) mice using combinations of primers shown in A demonstrates expected genomic structure of the targeted locus. (C and D) Loss of Tox mRNA demonstrated by RT-PCR (C) and TOX protein analyzed by immunoblotting (D) in total thymocytes from gene-targeted mice. Expression of the Actb gene and β-actin protein was used for controls. In this and all subsequent figures, protein masses are based on relative mobility in SDS-PAGE.
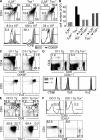
Figure 2.
TOX is required for CD4SP thymocyte development but not initiation of positive selection. (A) No statistically significant difference (P = 0.28) in total thymic cellularity of individual +/+ and −/− mice was observed. Mice ranging in age from 2.5 to 9 wk were analyzed as age-matched control and experimental pairs. Population means are shown as horizontal bars. (B) Maintenance of CD44- and CD25-defined DN subsets in lineage− (CD4−, CD8α−, B220−, DX-5−, and γδTCR−) thymocytes from Tox−/− mice. Numbers indicate frequency of DN1 (CD44+CD25), DN2 (CD44+CD25+), DN3 (CD44−CD25+), and DN4 (CD44+CD25−) subsets. (C) Maintenance of CD117- and CD25-defined DN subsets and ETP in lineage− (CD8α−, CD8β−, CD3ε−, TCR-β−, CD11b−, CD11c−, TER119−, CD19−, B220−, NK1.1−, and γδTCR−) thymocytes from Tox−/− mice. ETP (CD117+CD25−), DN2 (CD117+CD25+), DN3 (CD117−CD25+), and DN4 (CD117+CD25−) subsets are depicted. (D) Representative CD4/CD8 staining patterns of thymocytes derived from +/+, +/−, and −/− mice are shown. Numbers indicate frequency of indicated thymocyte subsets, expressed as a percentage in this figure and all subsequent figures unless otherwise indicated. (E) Compilation of the frequency of CD4- and CD8-defined thymocyte subsets in +/+ and −/− mice. CD8SP thymocytes were also gated on TCR+ cells to eliminate immature CD8SP thymocytes from the analysis. Statistically significant differences between the mean frequency of DD (P = 4.10−11) and 4SP (P = 1.10−12) +/+ and −/− thymocytes are indicated (**). (F) Absolute numbers of thymocyte subsets in +/+ (gray bars) and −/− (black bars) mice. Error bars refer to standard deviations (n = 16). Statistically significant differences between the mean absolute number of DD (P = 5.7 × 10⁻⁶), 4SP (P = 1.9 × 10⁻¹⁰), and 8SP (P = 0.0047) +/+ and −/− thymocytes are indicated (**) (G) Tox−/− thymocytes initiate positive selection based on marker up-regulation. Two-parameter analysis for expression of TCR-β and CD5 allows identification of developmental stages (labeled 1–4) that were then assessed for expression of CD4 and CD8.
Figure 3.
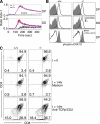
TCR signaling is intact in the absence of TOX. (A) Analysis of anti-CD3ε mAb induced calcium flux in wild-type (blue line) or Tox−/− (red line) gated populations of DP or DD thymocytes, as indicated. Control (black line) refers to Tox−/− thymocytes that were treated with anti-CD3ε mAb but did not receive the cross-linking secondary antibody. (B) Induction of phospho-ERK1/2 in DP and DD thymocytes upon TCR cross-linking as in A. To validate the specificity of staining, PMA stimulation of DP thymocytes with or without the MAPK or ERK kinase (MEK) inhibitor U0126 is also shown. (C) Purified DP thymocytes were analyzed directly (t = 0) or induced to differentiate by overnight culture without (medium) or with coimmobilized anti-CD2 and anti–TCR-β antibodies as indicated.
Figure 4.
The Tox−/− phenotype is T cell intrinsic. (A) Thymocytes from irradiated wild-type (B6, CD90.1+) mice reconstituted with a 1:1 mixture of CD90.2+CD45.2+ mutant (−/−) and CD90.2+CD45.1+ wild-type (B6) BM-derived cells were analyzed as shown. (B) Tox−/− thymocytes appear in the thymic cortex and medulla in mixed chimeric mice. Medullary regions are defined by staining of medullary epithelium with Ulex europaeus agglutinin I (UEA; red), wild-type (B6) cells are detected with anti-CD45.1 mAb (green), and mutant cells are detected with anti-CD45.2 mAb (blue). Bar, 100 μm.
Figure 5.
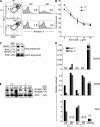
Tox−/− DD thymocytes are after positive selection but do not express the CD4 lineage commitment factor. (A) Total viable thymocytes, as determined by PI exclusion (PI−), were analyzed for binding of annexin V to gated populations of DP and DD thymocytes. (B) Purified DP thymocytes were treated with various concentrations of plate-bound anti-CD3ε mAb in the presence of anti-CD28 mAb. Cell viability was determined by PI and annexin V staining after overnight culture. Plotted frequencies represent mean ± SD of duplicate cultures. (C) The proapoptotic factor Bim is poorly expressed by the Tox−/− DD thymocyte population compared with wild-type. Total cell lysates from purified DD thymocytes were analyzed for Bim by Western blotting. BimEL is the prominent isoform present, although BimL and BimS were also detectable with longer exposure. Expression of β-actin was used as a loading control. (D) Quantitative real-time RT-PCR for Zbtb7b, Gata3, and Rag1 mRNA in purified populations of DP or DD thymocytes. Results are compared with mRNA derived from AND TCR-Tg total thymocytes, which was arbitrarily set to a value of 1.0. Where bars are not graphically visible, values or not detectable (ND) (Ct > 33 cycles) is indicated. (E) Runx3 protein is up-regulated in Tox−/− CD8SP thymocytes. Total cell lysates from sorted thymocyte populations were analyzed for expression of Runx1 and Runx3 by immunoblotting using a pan anti-Runx antibody. Expression of β-actin is shown for comparison.
Figure 6.
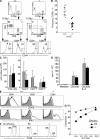
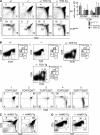
CD4 T lymphopenia but functional CD8 T cells in Tox−/− mice. (A) Profound loss of CD4 T cells and increase in frequency of CD44hi T cells in the spleens of Tox−/− mice as shown by four-color flow cytometry analysis. (B) Frequencies of TCR-β+ spleen cells are plotted for individual mice. Population means are shown as bars. A statistically significant reduction in the frequency of TCR-β+ spleen cells (P = 5.3 × 10⁻⁸) in −/− compared with +/+ mice is indicated (**). (C) Absolute numbers of total splenocytes, splenic T cells, and CD4 and CD8 T cell subsets in +/+ (gray bars) and −/− (black bars) mice. Error bars refer to standard deviations (n = 11). Statistically significant reductions in the number of TCR-β+ spleen cells (P = 0.026) and CD4 T cells (P = 3.10−4) in −/− compared with +/+ mice are indicated (**). (D) Tox−/− CD8 T cells are responsive to TCR activation. Proliferative response (mean [3H]-thymidine incorporation ± SD of triplicate cultures) of wild-type (gray bars) or Tox−/− (black bars) splenic CD8 T cells to anti-CD3ε and anti-CD28 mAb stimulation in the presence or absence of IL-2. (E) Mutant CD8 splenic T cells belong to the CD8 lineage. Gated populations of +/+ or −/− CD4 and CD8 splenic T cells were analyzed for induction of CD40L and IFN-γ production after culture in the absence (shaded) or presence (black line) of PMA and ionomycin. (F and G) Tox−/− CD8 T cells exhibit cytotoxic effector function. In vitro B10.BR (H-2k)-stimulated CD8 T cells from C57BL/6 or H-2b TOX−/− mice were tested for cytotoxicity against a mix of allogeneic CFSEhi B10.BR (BR) and syngeneic CFSElo C57BL/6 (B6) target cells. Cytolytic activity was determined by specific loss of CFSEhi-viable cells by flow cytometry using an E/T ratio of 10 in F, or as indicated in G, and calculated as in Materials and methods.
Figure 7.
Preferential development of class I but not class II MHC–specific T cells in Tox−/− mice. (A) Reduced development of TCR-β+ CD8SP in the absence of class I MHC. TCR-β expression on CD8SP (black line) is compared with DD thymocytes (shaded). Gate frequencies refer to the CD8SP subsets. The absolute number of TCR-β+ CD8SP cells in each animal is indicated above the TCR-β profiles. (B) Absolute numbers of TCR+ CD8SP thymocytes in β2M−/−, β2M−/− Tox−/− mice, and lethally irradiated β2M−/− or TAP-1−/− (TAP−/−) mice reconstituted with either wild-type (WT) or Tox−/− BM. (C) CD8SP thymocytes develop in OT-I TCR-Tg Tox−/− mice. Expression of CD4 and CD8 on total thymocytes or CD5 and Vα2 on gated CD8SP thymocytes is shown. (D) CD8 splenic T cells develop in OT-I TCR-Tg Tox−/− mice. Expression of CD8β, Vβ5, and Vα2 on a gated subpopulation of CD8α+ splenic T cells from +/+ (shaded) and −/− (black line) mice. (E) Total thymocytes were analyzed for CD4, CD8, CD5, and DO11 TCR expression. (F) Splenocytes were stained for CD4, CD8, and TCR-β. Shown is the expression of CD4 and CD8 on TCR-β+ cells.
Figure 8.
Expression of transgene-encoded TOX rescues CD4 T cell development in Tox−/− mice. (A) Frequency of cell populations in Tox+/− (+/−), Tox−/− (−/−), Tox+/− TOX-Tg (+/− TOX-Tg), and Tox−/− TOX-Tg (−/− TOX-Tg) mice in total thymocytes (top panels) or in TCRint/hi-gated thymocytes (bottom panels). Mean cell numbers of mature TCR+ CD4SP and CD8SP thymocytes are shown, and error bars indicate standard deviation (n = 3). (B) Five subpopulations (labeled 1–5) of Tox+/− (+/−), Tox−/− (−/−), Tox+/− TOX-Tg (+/− TOX-Tg), and Tox−/− TOX-Tg (−/− TOX-Tg) thymocytes based on expression of TCR and CD5 were analyzed. Expression of CD4 and CD8 on Tox−/− TOX-Tg (−/− TOX-Tg) thymocytes gated on CD5 and TCR is shown. (C and D) The frequency of thymocyte populations in Tox+/− (+/−) ΔHMG-Tg and Tox−/− (−/−) ΔHMG-Tg mice, stained as indicated.
Figure 9.
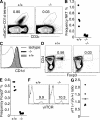
Development of γδT but not NKT or T reg cell precursor thymocytes in Tox−/− mice. (A) Inhibition of development of CD1d-dependent NKT cells in the thymus of Tox−/− mice as indicated by loss of CD3int αGalCer-CD1d tetramer+ thymocytes. (B) Compilation of data for individual animals generated as in A. (C) Expression of CD1d on +/+ (shaded histogram) and −/− (thick black line) DP thymocytes. Control isotype staining (thin black line) is shown on −/− DP thymocytes. (D) Inhibition of development of T reg cells in the thymus of Tox−/− mice as indicated by the loss of Foxp3+ thymocytes, the vast majority of which are CD4+ in wild-type mice. (E) Compilation of data for individual animals generated as in D. (F) Frequency (percentage) of γδTCR+ cells among otherwise lin− thymocytes in Tox−/− mice. (G) Compilation of analysis of six −/− and +/+ animal pairs expressed as the (−/−)/(+/+) ratio of the frequency of γδTCR+ thymocytes in each experiment. The frequency of γδTCR+ thymocytes was determined in total viable thymocytes, DN thymocytes, or lin− DN thymocytes in individual experiments. The mean ratio value is shown as a horizontal bar.
Figure 10.
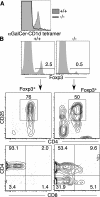
Loss of CD4+ NKT and T reg mature cells in Tox−/− mice. (A) Few αGalCer-CD1d tetramer+ cells are present in the spleens of Tox−/− (−/−) mice. (B) Tox−/− mice have fewer Foxp3+ splenic T cells and an increased proportion of CD25−CD4−CD8− Foxp3+ cells. Shown is the staining pattern for CD25 and CD4 or CD4 and CD8 among gated Foxp3+ splenocytes from +/+ and −/− mice.
Similar articles
- The duration of antigen receptor signalling determines CD4+ versus CD8+ T-cell lineage fate.
Yasutomo K, Doyle C, Miele L, Fuchs C, Germain RN. Yasutomo K, et al. Nature. 2000 Mar 30;404(6777):506-10. doi: 10.1038/35006664. Nature. 2000. PMID: 10761920 - TOX provides a link between calcineurin activation and CD8 lineage commitment.
Aliahmad P, O'Flaherty E, Han P, Goularte OD, Wilkinson B, Satake M, Molkentin JD, Kaye J. Aliahmad P, et al. J Exp Med. 2004 Apr 19;199(8):1089-99. doi: 10.1084/jem.20040051. Epub 2004 Apr 12. J Exp Med. 2004. PMID: 15078895 Free PMC article. - Generation of mature T cell populations in the thymus: CD4 or CD8 down-regulation occurs at different stages of thymocyte differentiation.
Marodon G, Rocha B. Marodon G, et al. Eur J Immunol. 1994 Jan;24(1):196-204. doi: 10.1002/eji.1830240131. Eur J Immunol. 1994. PMID: 7912676 - Commitment issues: linking positive selection signals and lineage diversification in the thymus.
Aliahmad P, Kaye J. Aliahmad P, et al. Immunol Rev. 2006 Feb;209:253-73. doi: 10.1111/j.0105-2896.2006.00345.x. Immunol Rev. 2006. PMID: 16448547 Review. - TCR and Notch signaling in CD4 and CD8 T-cell development.
Laky K, Fleischacker C, Fowlkes BJ. Laky K, et al. Immunol Rev. 2006 Feb;209:274-83. doi: 10.1111/j.0105-2896.2006.00358.x. Immunol Rev. 2006. PMID: 16448548 Review.
Cited by
- RAG suppresses group 2 innate lymphoid cells.
Ver Heul AM, Mack M, Zamidar L, Tamari M, Yang TL, Trier AM, Kim DH, Janzen-Meza H, Van Dyken SJ, Hsieh CS, Karo JM, Sun JC, Kim BS. Ver Heul AM, et al. bioRxiv [Preprint]. 2024 Apr 28:2024.04.23.590767. doi: 10.1101/2024.04.23.590767. bioRxiv. 2024. PMID: 38712036 Free PMC article. Preprint. - Transcription factor Tox2 is required for metabolic adaptation and tissue residency of ILC3 in the gut.
Das A, Martinez-Ruiz GU, Bouladoux N, Stacy A, Moraly J, Vega-Sendino M, Zhao Y, Lavaert M, Ding Y, Morales-Sanchez A, Harly C, Seedhom MO, Chari R, Awasthi P, Ikeuchi T, Wang Y, Zhu J, Moutsopoulos NM, Chen W, Yewdell JW, Shapiro VS, Ruiz S, Taylor N, Belkaid Y, Bhandoola A. Das A, et al. Immunity. 2024 May 14;57(5):1019-1036.e9. doi: 10.1016/j.immuni.2024.04.001. Epub 2024 Apr 26. Immunity. 2024. PMID: 38677292 - Functional CRISPR screens in T cells reveal new opportunities for cancer immunotherapies.
Xiang M, Li H, Zhan Y, Ma D, Gao Q, Fang Y. Xiang M, et al. Mol Cancer. 2024 Apr 5;23(1):73. doi: 10.1186/s12943-024-01987-z. Mol Cancer. 2024. PMID: 38581063 Free PMC article. Review. - Transcriptomic and intervention evidence reveals domestic dogs as a promising model for anti-inflammatory investigation.
Zeng M, Zhou T, Li Z, Li G, Zhang S, Wang L, Huang QG, Li JD, Samarawickrama PN, He Y, Wang GD. Zeng M, et al. Aging Cell. 2024 May;23(5):e14127. doi: 10.1111/acel.14127. Epub 2024 Mar 1. Aging Cell. 2024. PMID: 38426629 Free PMC article. - Tox induces T cell IL-10 production in a BATF-dependent manner.
Canaria DA, Rodriguez JA, Wang L, Yeo FJ, Yan B, Wang M, Campbell C, Kazemian M, Olson MR. Canaria DA, et al. Front Immunol. 2023 Nov 20;14:1275423. doi: 10.3389/fimmu.2023.1275423. eCollection 2023. Front Immunol. 2023. PMID: 38054003 Free PMC article.
References
- Lucas, B., and R.N. Germain. 1996. Unexpectedly complex regulation of CD4/CD8 coreceptor expression supports a revised model for CD4+CD8+ thymocyte differentiation. Immunity. 5:461–477. - PubMed
- Sant'Angelo, D.B., B. Lucas, P.G. Waterbury, B. Cohen, T. Brabb, J. Goverman, R.N. Germain, and C.A. Janeway Jr. 1998. A molecular map of T cell development. Immunity. 9:179–186. - PubMed
- Hogquist, K.A., A.J. Tomlinson, W.C. Kieper, M.A. McGargill, M.C. Hart, S. Naylor, and S.C. Jameson. 1997. Identification of a naturally occurring ligand for thymic positive selection. Immunity. 6:389–399. - PubMed
- Sato, T., S. Ohno, T. Hayashi, C. Sato, K. Kohu, M. Satake, and S. Habu. 2005. Dual functions of Runx proteins for reactivating CD8 and silencing CD4 at the commitment process into CD8 thymocytes. Immunity. 22:317–328. - PubMed
Publication types
MeSH terms
Substances
LinkOut - more resources
Full Text Sources
Other Literature Sources
Molecular Biology Databases
Research Materials
Miscellaneous

