Transcription factor Erg regulates angiogenesis and endothelial apoptosis through VE-cadherin - PubMed (original) (raw)
Transcription factor Erg regulates angiogenesis and endothelial apoptosis through VE-cadherin
Graeme M Birdsey et al. Blood. 2008.
Abstract
Tight regulation of the balance between apoptosis and survival is essential in angiogenesis. The ETS transcription factor Erg is required for endothelial tube formation in vitro. Inhibition of Erg expression in human umbilical vein endothelial cells (HUVECs), using antisense oligonucleotides, resulted in detachment of cell-cell contacts and increased cell death. Inhibition of Erg expression by antisense in HUVECs also lowered expression of the adhesion molecule vascular endothelial (VE)-cadherin, a key regulator of endothelial intercellular junctions and survival. Using chromatin immunoprecipitation, we showed that Erg binds to the VE-cadherin promoter. Furthermore, Erg was found to enhance VE-cadherin promoter activity in a transactivation assay. Apoptosis induced by inhibition of Erg was partly rescued by overexpression of VE-cadherin-GFP, suggesting that VE-cadherin is involved in the Erg-dependent survival signals. To show the role of Erg in angiogenesis in vivo, we used siRNA against Erg in a Matrigel plug model. Erg inhibition resulted in a significant decrease in vascularization, with increase in caspase-positive endothelial cells (ECs). These results identify a new pathway regulating angiogenesis and endothelial survival, via the transcription factor Erg and the adhesion molecule VE-cadherin.
Figures
Figure 1
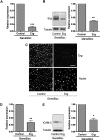
Inhibition of Erg expression in endothelial cells. HUVECs (105) grown on gelatin-coated 6-well plates were transfected with either control GB or Erg-specific GB (100 nM) for 48 hours. (A) Erg mRNA levels from RNA extracts were quantified using RT-PCR, normalized to GAPDH. Erg mRNA expression was significantly reduced after GB treatment, ***P < .001. Values are means plus or minus SEM, n = 4. (B) Whole-cell protein extracts were analyzed by sodium dodecyl sulfate–polyacrylamide gel electrophoresis (SDS-PAGE) immunoblotting with antibodies to Erg and tubulin. Erg protein expression was significantly reduced in the Erg-GB–treated cells, **P < .01. Values are means plus or minus SEM, n = 3. (C) Immunofluorescence analysis of the distribution and expression of Erg before and after GeneBloc treatment. Cells grown on gelatin-coated glass coverslips were transfected with GB as above. After 48 hours, cells were labeled and visualized for Erg (top) or the nuclear marker TOPRO-3 (bottom). Scale bar, 100 μm. (D) ICAM-2 mRNA levels, measured in RNA extracts from GB-treated HUVECs using RT-PCR, normalized against GAPDH, were significantly decreased after Erg inhibition, **P < .01. Values are means plus or minus SEM, n = 3. (E) ICAM-2 protein expression was also down-regulated in Erg-GB–treated HUVECs, as determined by SDS-PAGE immunoblotting using antibodies to ICAM-2, normalized against tubulin, *P < .05. Values are means plus or minus SEM, n = 3.
Figure 2
Erg regulates junctional integrity and VE-cadherin expression. (A) HUVECs (105 cells/well) grown on gelatin-coated 6-well plates were transfected with either control GB or Erg-specific GB (100 nM) for 48 hours. Phase-contrast microscopy shows that the typical cobblestone monolayer shown in the control cells (left) has become disrupted in the Erg-inhibited cells (right). Original magnification 20×/0.4 Plan N objective lens (Olympus, Tokyo, Japan). (B) HUVECs (105) grown on gelatin-coated 6-well plates were transfected with either control GB or Erg-specific GB (100 nM) for 48 hours. VE-cadherin mRNA levels were determined from RNA extracts from GB-treated HUVECs using RT-PCR normalized against GAPDH. VE-cadherin mRNA was significantly decreased after Erg inhibition, *P < 0.05. Values are means plus or minus SEM, n = 3. (C) VE-cadherin protein expression was also down-regulated in Erg-GB–treated HUVECs, as determined by SDS-PAGE immunoblotting using antibodies to VE-cadherin, normalized against tubulin. *P < .05. Values are means plus or minus SEM, n = 3. (D) HUVECs grown on gelatin-coated glass coverslips were treated with GB as above. After 48 hours, cells were labeled for Erg using a polyclonal rabbit anti-Erg antibody and for VE-cadherin using a mouse monoclonal anti–VE-cadherin antibody. Erg was visualized with AlexaFluor 488 (green), VE-cadherin with AlexaFluor 555 (red), and nuclei were stained with TOPRO-3 (blue). Scale bar, 100 μm. Objective lens used was Plan-Neofluar 20×/0.5 (Carl Zeiss, Jena, Germany). (E) Genomic DNA sequence of the proximal 5′-region of the human VE-cadherin gene. The transcription initiation site is designated as +1. The positions of the Ets binding sites (EBSs) are boxed. The 2 functional EBSs present in the murine sequence, and conserved in the human, are indicated by a double-lined box. Nucleotide sequences corresponding to the oligonucleotides used in the ChIP assay (see panel F) are indicated by arrows. The shaded nucleotides at the 5′ and 3′ ends of the sequence denote the position of oligonucleotides used for PCR amplification of the promoter for subsequent cloning into the pGL4 luciferase reporter plasmid. (F) Chromatin immunoprecipitation from a confluent HUVEC monolayer was performed as described in “Methods.” Genomic DNA obtained after immunoprecipitation, using a rabbit anti-Erg polyclonal antibody or a negative control rabbit IgG, was used as template in a PCR reaction with primers spanning a region of the VE-cadherin promoter containing 4 ETS-binding sites. The amplified product of 140 bp (base pair) was enriched in the Erg-precipitated chromatin sample (Erg) compared with the negative control IgG (Neg). To ensure the specificity of Erg binding to the VE-cadherin promoter, PCR amplification was also performed on the same samples using primers specific to the 3′ region of the VE-cadherin locus as negative control. PCR using the negative control primers gave rise to equivalent amounts of product from both samples, indicating nonspecifically captured DNA. (G) An Erg cDNA expression plasmid (pSG5Erg) was cotransfected with the VE-cadherin promoter-luciferase construct in HeLa cells, and luciferase activity was measured. Values are represented as the fold change in relative luciferase activity over the empty pGL4 vector alone. The VE-cadherin promoter was also cotransfected with an empty expression plasmid (pSG5). Erg transactivates the VE-cadherin promoter, **P < .01. Values are means plus or minus SEM, n = 5.
Figure 3
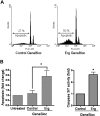
Erg inhibition increases apoptosis in HUVECs. (A) HUVECs (105) grown on gelatin-coated 6-well plates were transfected with either control GB or Erg-specific GB (100 nM) for 48 hours. Cells were fixed in ethanol and stained with propidium iodide. Sub-G1 apoptotic nuclei were quantified by flow cytometry. Inhibition of Erg increased apoptosis by 3-fold, *P < .05. Values are means plus or minus SEM, n = 3. (B) The regulation of apoptosis by Erg was confirmed by measuring caspase-3 or -7 activity. HUVECs (2 × 10³) grown in 96-well microplates were treated with GB as above. After 48 hours, luminescence was measured using the Caspase-3 or -7 Glo Assay (Promega). *P < .05. Values are means plus or minus SEM, n = 4.
Figure 4
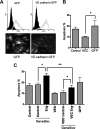
VE-cadherin protects HUVECs from apoptosis. (A) HUVECs (105) grown in 6-well plates were transduced with adenovirus (VE-cadherin [VEC]–-GFP and GFP). Four days later, GFP expression levels were determined by flow cytometry, and GFP autofluorescence was visualized using confocal microscopy. Objective lens used was Plan-Neofluar 40×/1.3 oil (Carl Zeiss). VE-cadherin–GFP localizes to the endothelial cell junctions. (B) To quantify apoptosis, cells were fixed in ethanol and stained for propidium iodide. Sub-G1 apoptotic nuclei were quantified by flow cytometry. Expression of VE-cadherin–GFP significantly reduces cell death, *P < .05. Values are means plus or minus SEM, n = 7. (C) HUVECs (105) grown in 6-well dish were transduced with adenovirus (VEC-GFP and GFP). After 48 hours, cells were transfected with either control GB or Erg-specific GB (100 nM). After a further 48 hours, cells were fixed in ethanol and stained with propidium iodide to determine apoptosis. Apoptosis induced by Erg inhibition was significantly decreased in the VE-cadherin overexpressing cells, indicating that the survival pathway regulated by Erg involves VE-cadherin. *P < .05, **P < .01. Values are means plus or minus SEM, n = 7.
Figure 5
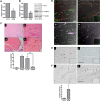
Inhibition of angiogenesis in vivo by Erg siRNA. (A) HUVECs (105) grown on gelatin-coated 6-well plates were transfected with either control siRNA or Erg-specific siRNA (30 nM) for 48 hours. Erg mRNA levels were quantified using RT-PCR, normalized to GAPDH. Erg mRNA expression was significantly reduced after Erg-siRNA treatment, **P < .01. Values are means plus or minus SEM, n = 3. (B) Whole-cell protein extracts were analyzed by SDS-PAGE immunoblotting with antibodies to Erg and tubulin. Erg protein expression was significantly reduced in the Erg-siRNA treated cells, **P < .01. Values are means plus or minus SEM, n = 3. ICAM-2 protein expression was also down-regulated in Erg-siRNA–treated HUVECs, as determined by SDS-PAGE immunoblotting using antibodies to ICAM-2. (C) Matrigel mixture containing siRNA (2 μM) with or without bFGF (80 ng/mL) was injected subcutaneously into C57BL/6 mice. Matrigel plugs were harvested 7 days after implantation, fixed, sectioned, and H&E stained. (i) Matrigel plug without bFGF. (ii) Matrigel plug plus bFGF. (iii) Matrigel plug with bFGF plus Erg siRNA. (iv) Matrigel plug with bFGF plus luciferase control siRNA. Neovessels containing red blood cells (arrows). Original magnification was 10 ×/0.25 Plan objective lens (Olympus). Vessel density was quantified by counting the number of structures containing a lumen and red blood cells. ** indicates P less than .01. Values are means plus or minus SEM, n = 5. (D) Sections from Matrigel plugs treated with siRNA for luciferase (i,iii) or Erg (ii,iv) were stained with antibodies to CD34 (i,ii) or CD45 (iii,iv) and visualized by immunofluorescence confocal microscopy, overlaid with a transmitted light DIC image to enable the vascular structure of the plug to be observed. For CD34 (red), staining is most intense among endothelial cells lining the neovessels (arrows). The pan-leukocyte CD45 antibody (purple) stains isolated cells of the inflammatory infiltrate within the Matrigel matrix and leukocytes inside the lumen of the neovessels (arrows); however. CD45+ cells are also found lining the neovessels, as previously reported. Cell nuclei were counterstained with Sytox Green. Inset: IgG-negative controls. Objective lens used was Plan Neofluar 20×/0.5 (Carl Zeiss). Scale bar represents 50 μm. (E) Immunohistochemistry staining with an anti-Erg Ab in the Matrigel plug sections. (i) Endothelial cells lining neovessels express Erg in Luc-siRNA–treated plugs (arrows). (ii) Plugs treated with Erg siRNA show reduced Erg staining. Insert: Control IgG. Original magnification 20×/0.4 Plan N objective lens (Olympus). Scale bar represents 50 μm. (F) (i) Rare apoptotic cells, as shown by anti-Active caspase 3 staining (arrow), are found in Luc-siRNA–treated Matrigel plug samples. (ii) Active Caspase 3–positive ECs are found in Erg siRNA-treated Matrigel plug samples and appear detached from the vessel wall (arrows). *P < .05. Values are means plus or minus SEM n = 3 Erg and n = 5 control. Scale bar represents 50 μm.
Similar articles
- TAL-1/SCL and its partners E47 and LMO2 up-regulate VE-cadherin expression in endothelial cells.
Deleuze V, Chalhoub E, El-Hajj R, Dohet C, Le Clech M, Couraud PO, Huber P, Mathieu D. Deleuze V, et al. Mol Cell Biol. 2007 Apr;27(7):2687-97. doi: 10.1128/MCB.00493-06. Epub 2007 Jan 22. Mol Cell Biol. 2007. PMID: 17242194 Free PMC article. - The transcription factor Erg regulates expression of histone deacetylase 6 and multiple pathways involved in endothelial cell migration and angiogenesis.
Birdsey GM, Dryden NH, Shah AV, Hannah R, Hall MD, Haskard DO, Parsons M, Mason JC, Zvelebil M, Gottgens B, Ridley AJ, Randi AM. Birdsey GM, et al. Blood. 2012 Jan 19;119(3):894-903. doi: 10.1182/blood-2011-04-350025. Epub 2011 Nov 23. Blood. 2012. PMID: 22117042 - VE-cadherin: the major endothelial adhesion molecule controlling cellular junctions and blood vessel formation.
Vestweber D. Vestweber D. Arterioscler Thromb Vasc Biol. 2008 Feb;28(2):223-32. doi: 10.1161/ATVBAHA.107.158014. Epub 2007 Dec 27. Arterioscler Thromb Vasc Biol. 2008. PMID: 18162609 Review. - Dynamic Regulation of Vascular Permeability by Vascular Endothelial Cadherin-Mediated Endothelial Cell-Cell Junctions.
Rho SS, Ando K, Fukuhara S. Rho SS, et al. J Nippon Med Sch. 2017;84(4):148-159. doi: 10.1272/jnms.84.148. J Nippon Med Sch. 2017. PMID: 28978894 Review.
Cited by
- CDH5 is specifically activated in glioblastoma stemlike cells and contributes to vasculogenic mimicry induced by hypoxia.
Mao XG, Xue XY, Wang L, Zhang X, Yan M, Tu YY, Lin W, Jiang XF, Ren HG, Zhang W, Song SJ. Mao XG, et al. Neuro Oncol. 2013 Jul;15(7):865-79. doi: 10.1093/neuonc/not029. Epub 2013 May 3. Neuro Oncol. 2013. PMID: 23645533 Free PMC article. - Oncogene-mediated alterations in chromatin conformation.
Rickman DS, Soong TD, Moss B, Mosquera JM, Dlabal J, Terry S, MacDonald TY, Tripodi J, Bunting K, Najfeld V, Demichelis F, Melnick AM, Elemento O, Rubin MA. Rickman DS, et al. Proc Natl Acad Sci U S A. 2012 Jun 5;109(23):9083-8. doi: 10.1073/pnas.1112570109. Epub 2012 May 21. Proc Natl Acad Sci U S A. 2012. PMID: 22615383 Free PMC article. - Slit2 signaling through Robo1 and Robo2 is required for retinal neovascularization.
Rama N, Dubrac A, Mathivet T, Ní Chárthaigh RA, Genet G, Cristofaro B, Pibouin-Fragner L, Ma L, Eichmann A, Chédotal A. Rama N, et al. Nat Med. 2015 May;21(5):483-91. doi: 10.1038/nm.3849. Epub 2015 Apr 20. Nat Med. 2015. PMID: 25894826 Free PMC article. - Tumour angiogenesis is reduced in the Tc1 mouse model of Down's syndrome.
Reynolds LE, Watson AR, Baker M, Jones TA, D'Amico G, Robinson SD, Joffre C, Garrido-Urbani S, Rodriguez-Manzaneque JC, Martino-Echarri E, Aurrand-Lions M, Sheer D, Dagna-Bricarelli F, Nizetic D, McCabe CJ, Turnell AS, Kermorgant S, Imhof BA, Adams R, Fisher EM, Tybulewicz VL, Hart IR, Hodivala-Dilke KM. Reynolds LE, et al. Nature. 2010 Jun 10;465(7299):813-7. doi: 10.1038/nature09106. Nature. 2010. PMID: 20535211 Free PMC article. - A non-coding genetic variant associated with abdominal aortic aneurysm alters ERG gene regulation.
Marsman J, Gimenez G, Day RC, Horsfield JA, Jones GT. Marsman J, et al. Hum Mol Genet. 2020 Mar 13;29(4):554-565. doi: 10.1093/hmg/ddz256. Hum Mol Genet. 2020. PMID: 31691800 Free PMC article.
References
- Lang R, Lustig M, Francois F, Sellinger M, Plesken H. Apoptosis during macrophage-dependent ocular tissue remodeling. Development. 1994;120:3395–3403. - PubMed
- Gobe G, Browning J, Howard T, et al. Apoptosis occurs in endothelial cells during hypertension-induced microvascular rarefaction. J Struct Biol. 1997;118:63–72. - PubMed
- Polverini PJ, Nor JE. Apoptosis and predisposition to oral cancer. Crit Rev Oral Biol Med. 1999;10:139–152. - PubMed
Publication types
MeSH terms
Substances
LinkOut - more resources
Full Text Sources
Other Literature Sources
Molecular Biology Databases


