Hypoxia regulates TSC1/2-mTOR signaling and tumor suppression through REDD1-mediated 14-3-3 shuttling - PubMed (original) (raw)
Hypoxia regulates TSC1/2-mTOR signaling and tumor suppression through REDD1-mediated 14-3-3 shuttling
Maurice Phillip DeYoung et al. Genes Dev. 2008.
Abstract
Hypoxia induces rapid and dramatic changes in cellular metabolism, in part through inhibition of target of rapamycin (TOR) kinase complex 1 (TORC1) activity. Genetic studies have shown the tuberous sclerosis tumor suppressors TSC1/2 and the REDD1 protein to be essential for hypoxia regulation of TORC1 activity in Drosophila and in mammalian cells. The molecular mechanism and physiologic significance of this effect of hypoxia remain unknown. Here, we demonstrate that hypoxia and REDD1 suppress mammalian TORC1 (mTORC1) activity by releasing TSC2 from its growth factor-induced association with inhibitory 14-3-3 proteins. Endogenous REDD1 is required for both dissociation of endogenous TSC2/14-3-3 and inhibition of mTORC1 in response to hypoxia. REDD1 mutants that fail to bind 14-3-3 are defective in eliciting TSC2/14-3-3 dissociation and mTORC1 inhibition, while TSC2 mutants that do not bind 14-3-3 are inactive in hypoxia signaling to mTORC1. In vitro, loss of REDD1 signaling promotes proliferation and anchorage-independent growth under hypoxia through mTORC1 dysregulation. In vivo, REDD1 loss elicits tumorigenesis in a mouse model, and down-regulation of REDD1 is observed in a subset of human cancers. Together, these findings define a molecular mechanism of signal integration by TSC1/2 that provides insight into the ability of REDD1 to function in a hypoxia-dependent tumor suppressor pathway.
Figures
Figure 1.
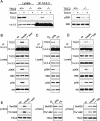
REDD1 and TSC2 are required for inhibition of mTORC1 activity in response to hypoxia. Dephosphorylation of S6K (T389) and 4E-BP1 (T70) is observed in wild-type but not _REDD1_−/− or _TSC2_−/− cells. MEFs of each genotype growing in 10% serum were exposed to hypoxia (1% O2) for the indicated times. The same blot was stripped and reprobed for the respective total proteins. Note the prominence of hypophosphorylated 4E-BP1 (lower band) upon hypoxic exposure of wild-type cells. β-Tubulin (b-tubulin) serves as a loading control.
Figure 2.
Hypoxia opposes the PI3K-dependent 14–3–3/TSC2 association and mTORC1 activation. (A) The interaction of endogenous TSC2 and 14–3–3 is serum-inducible. Wild-type or _TSC2_−/− MEFs were serum-starved, then treated with serum (90 min) followed by IP for endogenous 14–3–3. (Right) pS6K (T389) indicating serum-induced activation of mTORC1. As expected, _TSC2_−/− cells exhibit elevated basal mTORC1 activity and reduced serum-responsiveness. (B) The endogenous TSC2/14–3–3 interaction is PI3K-dependent. MEFs were serum-starved, then treated with insulin (200 nM, 90 min) or pretreated with wortmannin (100 nM, 30 min) followed by insulin, prior to IP for endogenous 14–3–3. (C) Hypoxia induces TSC2/14–3–3 dissociation. MEFs in 10% serum were exposed to hypoxia (1% O2) for 3 h prior to IP as above. (D) Hypoxia opposes insulin-induced TSC2/14–3–3 association. Cells (293T) were serum-starved, then treated with insulin (200 nM, 5 h) or exposed to hypoxia (hyp) beginning 1 h prior to insulin treatment, followed by IP as above. Note that both wortmannin and hypoxia inhibit complex formation and mTORC1-dependent phosphorylation of S6K (T389), while only wortmannin inhibits AKT phosphorylation. (E) Hypoxia does not induce TSC2 dephosphorylation, unlike serum starvation or wortmannin. Lysates from experiments B–D were probed with the indicated phospho-specific TSC2 antibodies.
Figure 3.
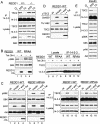
TSC2/14–3–3 binding is important for hypoxia regulation of mTORC1. (A) AKT-dependent phosphorylation sites on TSC2 are required for 14–3–3 binding. Wild-type (WT) TSC2, the indicated point mutants, or the double mutant (SATA) were transfected into _TSC2_−/− cells, followed by IP for endogenous 14–3–3. S1210 is an MK2-phosphorylated site whose mutation does not dramatically affect 14–3–3 binding. (B) S939/T1462 are required for PI3K-dependent regulation of TSC2/14–3–3 binding. _TSC2_−/− cells were stably reconstituted with wild-type or SATA TSC2, then cells in full serum were treated with wortmannin (100 nM, 60 min) followed by IP for endogenous 14–3–3. (C) Absence of hypoxia regulation of mTORC1 correlates with defective TSC2/14–3–3 interaction. Stably reconstituted cells shown in B were exposed to hypoxia (3 h), followed by IP for endogenous 14–3–3 or Western blot analysis for phospho-S6K (T389) to assess mTORC1 activity. The same blot was stripped and reprobed for total S6K.
Figure 4.
A conserved 14–3–3-binding motif within REDD1 is required for mTORC1 signaling and TSC2/14–3–3 regulation. (A) Endogenous REDD1 is required for hypoxia-induced TSC2/14–3–3 dissociation. MEFs of the indicated genotype were treated with hypoxia (3 h) followed by Western analysis or IP for endogenous 14–3–3. Hypoxia-induced TSC2/14–3–3 dissociation and S6K1 (T389) dephosphorylation are both absent in _REDD1_−/− MEFs. (B) Induction of REDD1 but not the REDD1-RPAA mutant inhibits mTORC1 activity and the endogenous TSC2/14–3–3 association. Expression of REDD1 was induced with tetracycline (Tet) for 3 h (hrs) in U2OS cells, followed by Western blot analysis or IP for endogenous 14–3–3. Dephosphorylation of S6K (T389) (lane 1 vs. lane 2) and TSC2/14–3–3 dissociation (lane 9 vs. lane 10) are only induced by wild-type REDD1. (C) Induction of REDD1 but not REDD1-RPAA opposes insulin-induced mTORC1 activation and endogenous TSC2/14–3–3 association. Cells were serum-starved, then treated with insulin (200 nM, 2 h), or were pretreated with wortmannin (100 nM, 30 min) or REDD1 induction (Tet, 60 min) prior to insulin (I) treatment. Lysates were analyzed by Western blot analysis and by IP for endogenous 14–3–3. Only wild-type REDD1 blocks insulin-induced S6K (T389) phosphorylation (lane 2 vs. lane 4) and opposes TSC2/14–3–3 association (lane 10 vs. lane 12). Note that REDD1 induction, unlike wortmannin treatment, does not affect AKT (S473) phosphorylation. (D) REDD1-mediated S6K dephosphorylation and TSC2/14–3–3 dissociation do not involve a change in AKT-dependent TSC2 phosphorylation. Lysates shown in C were probed for the indicated phosphorylated TSC2 residues. (E) Hypoxia replicates tetracycline-induced wild-type REDD1 in opposing insulin effects on TSC2/mTORC1 signaling. Serum-starved MEFs were treated with insulin (200 nM) prior to hypoxia (3 h).
Figure 5.
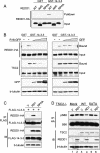
REDD1 binds 14–3–3 through the conserved binding motif. (A) REDD1 binding to 14–3–3 requires the conserved motif. 293T cells were transfected with wild-type (WT) REDD1, REDD1-delC (lacking the conserved central domain), or REDD1-RPAA, and lysates were purified by binding to GST or GST-14–3–3, followed by elution and Western blot analysis of bound protein. (B) Competition assay showing specific binding of REDD1 to 14–3–3. REDD1 was expressed as above, and lysates were incubated in the presence of increasing amounts of the 14–3–3-binding R18 decoy peptide fused to GFP (R18-GFP, left) or GFP control (right). Like REDD1, TSC2 also exhibits specific binding to 14–3–3, which can be competed out by R18-GFP but not GFP alone. (C) REDD1 but not REDD1-RPAA coimmunoprecipitates with 14–3–3. REDD1 and 14–3–3ζ were cotransfected into 293T cells, followed by IP for tagged 14–3–3. (D) REDD1 inhibition of mTORC1 activity requires TSC2/14–3–3 binding. _TSC2_−/− MEFs stably reconstituted with wild-type (WT) or mutant (SATA) TSC2 were cotransfected with REDD1 and HA-S6K, followed by IP for HA-S6K. REDD1-mediated dephosphorylation of S6K (T389) requires WT-TSC2 (lane 4) and is defective in SATA-TSC2-reconstituted cells (lane 6).
Figure 6.
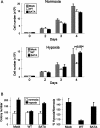
Failure of hypoxia signaling through TSC2/14–3–3 promotes proliferation and anchorage-independent growth. (A) Proliferation advantage of _TSC2_−/− and TSC2-SATA-reconstituted cells (Fig. 3) specifically in hypoxia. Equal numbers of cells were plated in normoxia or hypoxia (1% O2), and viable cells were counted daily by trypan blue exclusion assay. Error bars show SD for triplicate plates in this representative experiment; _P_-value was derived from two-tailed Student’s _t_-test. (B) Hypoxia enhances colony formation when hypoxia signaling through TSC2/14–3–3 is defective. The indicated cells were transformed with H-Ras(V12), then plated in soft agar as described (see Materials and Methods) for 3 wk in either normoxia or hypoxia (1% O2). (Left) Colony counts performed in triplicate for a representative experiment. Error bars show SD. (Right) Summary of three independent experiments performed in triplicate. Error bars show SEM.
Figure 7.
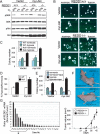
REDD1-dependent hypoxia signaling suppresses tumorigenesis. (A) REDD1-dependent inhibition of mTORC1 in cells expressing myr-AKT. Fibroblasts expressing SV40 LTAg were infected with a control or myr-AKT-expressing retrovirus, then were treated with hypoxia for 3 h prior to Western analysis. (B) Photomicrographs demonstrating a substantially greater number of colonies under hypoxic conditions in the absence of REDD1. LTAg-expressing MEFs were infected with myr-AKT or a control retroviral vector and plated in soft agar under normoxic or hypoxic (1% O2) conditions. (C) Endogenous REDD1 suppresses anchorage-independent growth in hypoxia. Soft agar colony counts performed in triplicate for a representative experiment. Error bars equal SD. (D) Summary of three independent experiments, each performed in triplicate. Error bars equal SEM. (E) REDD1 suppresses anchorage-independent growth in hypoxia through mTORC1 regulation. Soft agar assay was performed in the presence or absence of rapamycin (25 nM) in LTAg-_REDD1_−/− MEFs infected with myr-AKT for 2 wk. Colony counts performed in triplicate for a representative experiment. Error bars equal SD. (F) Loss of REDD1 promotes tumorigenesis in vivo. Nude mice were injected with 2 × 10⁶ myr-AKT-expressing cells described above. (Top) Representative mice showing large tumors in right (_REDD1_−/−-injected) but not left (wild-type-injected) flank. (Bottom) Mean tumor volume (N = 12 mice for each genotype). (G) REDD1 expression is down-regulated in primary breast carcinomas relative to specimen-matched normal epithelium. The ratio of REDD1 expression in normal/tumor pairs is shown, such that higher bars indicate lower tumor-specific REDD1 expression; asterisk (*) indicates tumors with more than twofold REDD1 down-regulation. Error bars show SD of three measurements.
Figure 8.
Model for REDD1-dependent regulation of mTORC1 activity and cell growth. Insulin and other growth factors activate mTORC1 through AKT-mediated phosphorylation of TSC2, which promotes TSC2/14–3–3 association and thereby inhibits TSC1/2 function. In response to hypoxia, REDD1 is induced and binds 14–3–3, resulting in TSC2/14–3–3 dissociation, TSC1/2 activation, and mTORC1 inhibition. REDD1 can inhibit mTORC1 even in the presence of constitutive AKT activation. Consequently, loss of REDD1 in this setting induces further mTORC1 activation that drives tumorigenesis.
Similar articles
- Cell-type-dependent regulation of mTORC1 by REDD1 and the tumor suppressors TSC1/TSC2 and LKB1 in response to hypoxia.
Wolff NC, Vega-Rubin-de-Celis S, Xie XJ, Castrillon DH, Kabbani W, Brugarolas J. Wolff NC, et al. Mol Cell Biol. 2011 May;31(9):1870-84. doi: 10.1128/MCB.01393-10. Epub 2011 Mar 7. Mol Cell Biol. 2011. PMID: 21383064 Free PMC article. - Growth control under stress: mTOR regulation through the REDD1-TSC pathway.
Ellisen LW. Ellisen LW. Cell Cycle. 2005 Nov;4(11):1500-02. doi: 10.4161/cc.4.11.2139. Epub 2005 Nov 1. Cell Cycle. 2005. PMID: 16258273 Review. - Regulation of mTOR function in response to hypoxia by REDD1 and the TSC1/TSC2 tumor suppressor complex.
Brugarolas J, Lei K, Hurley RL, Manning BD, Reiling JH, Hafen E, Witters LA, Ellisen LW, Kaelin WG Jr. Brugarolas J, et al. Genes Dev. 2004 Dec 1;18(23):2893-904. doi: 10.1101/gad.1256804. Epub 2004 Nov 15. Genes Dev. 2004. PMID: 15545625 Free PMC article. - Regulation of mTOR and cell growth in response to energy stress by REDD1.
Sofer A, Lei K, Johannessen CM, Ellisen LW. Sofer A, et al. Mol Cell Biol. 2005 Jul;25(14):5834-45. doi: 10.1128/MCB.25.14.5834-5845.2005. Mol Cell Biol. 2005. PMID: 15988001 Free PMC article. - A complex interplay between Akt, TSC2 and the two mTOR complexes.
Huang J, Manning BD. Huang J, et al. Biochem Soc Trans. 2009 Feb;37(Pt 1):217-22. doi: 10.1042/BST0370217. Biochem Soc Trans. 2009. PMID: 19143635 Free PMC article. Review.
Cited by
- Rapamycin Induces an eNOS (Endothelial Nitric Oxide Synthase) Dependent Increase in Brain Collateral Perfusion in Wistar and Spontaneously Hypertensive Rats.
Beard DJ, Li Z, Schneider AM, Couch Y, Cipolla MJ, Buchan AM. Beard DJ, et al. Stroke. 2020 Sep;51(9):2834-2843. doi: 10.1161/STROKEAHA.120.029781. Epub 2020 Aug 10. Stroke. 2020. PMID: 32772681 Free PMC article. - TSC2/mTORC1 signaling controls Paneth and goblet cell differentiation in the intestinal epithelium.
Zhou Y, Rychahou P, Wang Q, Weiss HL, Evers BM. Zhou Y, et al. Cell Death Dis. 2015 Feb 5;6(2):e1631. doi: 10.1038/cddis.2014.588. Cell Death Dis. 2015. PMID: 25654764 Free PMC article. - Regulation of mRNA translation by signaling pathways.
Roux PP, Topisirovic I. Roux PP, et al. Cold Spring Harb Perspect Biol. 2012 Nov 1;4(11):a012252. doi: 10.1101/cshperspect.a012252. Cold Spring Harb Perspect Biol. 2012. PMID: 22888049 Free PMC article. Review. - Investigating Glioblastoma Response to Hypoxia.
Chédeville AL, Lourdusamy A, Monteiro AR, Hill R, Madureira PA. Chédeville AL, et al. Biomedicines. 2020 Aug 27;8(9):310. doi: 10.3390/biomedicines8090310. Biomedicines. 2020. PMID: 32867190 Free PMC article. - Hormesis does not make sense except in the light of TOR-driven aging.
Blagosklonny MV. Blagosklonny MV. Aging (Albany NY). 2011 Nov;3(11):1051-62. doi: 10.18632/aging.100411. Aging (Albany NY). 2011. PMID: 22166724 Free PMC article.
References
- Arsham A.M., Howell J.J., Simon M.C. A novel hypoxia-inducible factor-independent hypoxic response regulating mammalian target of rapamycin and its targets. J. Biol. Chem. 2003;278:29655–29660. - PubMed
- Blouw B., Song H., Tihan T., Bosze J., Ferrara N., Gerber H.P., Johnson R.S., Bergers G. The hypoxic response of tumors is dependent on their microenvironment. Cancer Cell. 2003;4:133–146. - PubMed
Publication types
MeSH terms
Substances
LinkOut - more resources
Full Text Sources
Other Literature Sources
Molecular Biology Databases
Miscellaneous

