Plasma adiponectin complexes have distinct biochemical characteristics - PubMed (original) (raw)
Comparative Study
. 2008 May;149(5):2270-82.
doi: 10.1210/en.2007-1561. Epub 2008 Jan 17.
Affiliations
- PMID: 18202126
- PMCID: PMC2329278
- DOI: 10.1210/en.2007-1561
Comparative Study
Plasma adiponectin complexes have distinct biochemical characteristics
Todd Schraw et al. Endocrinology. 2008 May.
Abstract
Adipocytes release the secretory protein adiponectin in a number of different higher-order complexes. Once synthesized and assembled in the secretory pathway of the adipocyte, these complexes circulate as biochemically distinct and stable entities with little evidence of interchange between the different forms that include a high-molecular-weight (HMW) species, a hexamer (low-molecular-weight form), and a trimeric form of the complexes. Here, we validate a high-resolution gel filtration method that reproducibly separates the three complexes in recombinant adiponectin and adiponectin from human and murine samples. We demonstrate that the HMW form is prominently reduced in male vs. female subjects and in obese, insulin-resistant vs. lean, insulin-sensitive individuals. A direct comparison of human and mouse adiponectin demonstrates that the trimer is generally more abundant in human serum. Furthermore, when the production of adiponectin is reduced, either by obesity or in mice carrying only a single functional allele of the adiponectin locus, then the amount of the HMW form is selectively reduced in circulation. The complex distribution of adiponectin can be regulated in several ways. Both mouse and human HMW adiponectin are very stable under basic conditions but are exquisitely labile under acidic conditions below pH 7. Murine and human adiponectin HMW forms also display differential susceptibility to the presence of calcium in the buffer. A mutant form of adiponectin unable to bind calcium is less susceptible to changes in calcium concentrations. However, the lack of calcium binding results in a destabilization of the structure. Disulfide bond formation (at position C39) is also important for complex formation. A mutant form of adiponectin lacking C39 prominently forms HMW and trimer but not the low-molecular-weight form. Injection of adiponectin with a fluorescent label reveals that over time, the various complexes do not interconvert in vivo. The stability of adiponectin complexes highlights that the production and secretion of these forms from fat cells has a major influence on the circulating levels of each complex.
Figures
Figure 1
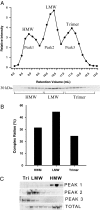
Adiponectin separated by gel filtration chromatography. A, The tissue culture supernatant from HEK-293T cell expressing mouse adiponectin (200 μl) was injected onto the gel filtration column in HEPES/Ca2+ buffer. The relative intensity of the mouse adiponectin is plotted against the retention volume of each fraction (•). Three peaks are clearly separated, representing the HMW, LMW, and trimer. B, A bar graph of the complex distribution of each peak was calculated by dividing the area under the curve for each peak by the total area under the curve for the entire spectrum. C, Pooled fractions for each peak were separated by velocity sedimentation over a sucrose gradient and compared with the original sample. The 10 fractions were separated by SDS-PAGE, and the Western blot was performed using the same primary and secondary antibodies mentioned above. Each peak is highly enriched for the individual complex of adiponectin as expected.
Figure 2
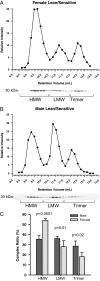
Adiponectin complex distribution in human samples from lean, insulin-sensitive males and females. A and B, A representative complex distribution of adiponectin from female (A) and male (B) human serum samples are shown. Samples (20 μl) were injected onto the gel filtration column equilibrated in HEPES/Ca2+ buffer. The relative intensity of human adiponectin is plotted against the retention volume of each fraction (•). C, Quantification of the complex distribution of adiponectin from male (n = 4) and female serum samples (n = 4). The percentage of each complex was calculated by dividing the area under the curve for each peak by the total area under the curve for the entire spectrum.
Figure 3
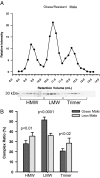
Adiponectin distribution in human samples from obese, insulin-resistant males. A, A representative complex distribution of adiponectin from obese/resistant male serum samples. Samples (25 μl) were injected onto the gel filtration column equilibrated in HEPES/Ca2+ buffer. The relative intensity of the human adiponectin is plotted against the retention volume of each fraction (•). B, Quantification of the complex distribution of adiponectin from lean, insulin-sensitive male samples (n = 4) and obese, insulin-resistant male samples (n = 4). The percentage of each complex was calculated by dividing the area under the curve for each peak by the total area under the curve for the entire spectrum.
Figure 4
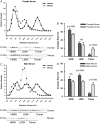
Comparison of adiponectin complex distribution in human vs. mouse serum samples. The data from the human serum samples in Fig. 3 was compared with data obtained from male and female mice. A, A representative complex distribution of adiponectin from female mouse serum (n = 5) compared with female human serum samples (n = 4). B, A representative complex distribution of adiponectin from male mouse serum (n = 5) compared with male human serum samples (n = 4). Serum samples from female mice (20 μl) and male mice (25 μl) were injected onto the gel filtration column equilibrated in HEPES/Ca2+ buffer. The relative intensity of each fraction is plotted against the retention volume for mouse (□) and human (•). Quantification of the complex distribution of adiponectin was shown for females (B) and males (D). The percentage of each complex was calculated by dividing the area under the curve for each peak by the total area under the curve for the entire spectrum.
Figure 5
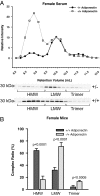
Adiponectin complex distribution from mice lacking a single allele for adiponectin. The data from the female mouse serum samples in Fig. 4A was compared with data obtained from female mice that are heterozygous for adiponectin. A, A representative complex distribution of adiponectin from female wild-type mice compared with female mice lacking a single adiponectin allele. Serum samples (25 μl) from female heterozygous mice (•, −/+) and female wild-type mice (□, +/+) were injected onto the gel filtration column equilibrated in HEPES/Ca2+ buffer. The relative intensity of the adiponectin is plotted against the retention volume of each fraction. B, Quantification of the complex distribution of adiponectin from female heterozygous (n = 4) and wild-type samples (n = 5). The percentage of each complex was calculated by dividing the area under the curve for each peak by the total area under the curve for the entire spectrum.
Figure 6
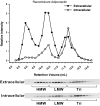
Complex distribution of adiponectin in the supernatant and cellular extract. Day 8 in vitro differentiated 3T3-L1 adipocytes were incubated with 3 ml serum-free DMEM, and the supernatant was collected after 4 h. The medium was loaded on a gel filtration column, and the complex distribution of adiponectin was determined by Western blot using antimouse adiponectin antibodies. The same cells were treated in lysis buffer with Triton X-100. Cellular extracts were separated by gel filtration using the HEPES/Ca2+ buffer plus Triton X-100, and the complex distribution was analyzed in a similar fashion.
Figure 7
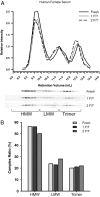
Adiponectin is stable after two freeze-thaw cycles. A, The complex distribution of adiponectin from human female serum. Female human serum samples (20 μl) were fractionated on a gel filtration column equilibrated in HEPES/Ca2+ buffer. Fresh serum samples were compared with the same sample that was rapidly frozen and thawed at 25 C (1 F/T). In addition, the same sample was rapidly frozen and then thawed at 25 C for a second time (2 F/T). The relative intensity of adiponectin was plotted against the retention volume of each fraction. B, The quantification of complex distribution for adiponectin was graphed to show the differences after one and two rounds of freezing and then thawing. The percentage of each complex was calculated by dividing the area under the curve for each peak by the total area under the curve for the entire spectrum.
Figure 8
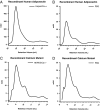
Stability of adiponectin complexes under acidic conditions. Recombinant human, mouse, mouse calcium-binding mutant, and mouse C39S mutant adiponectin were separated by gel filtration chromatography and subjected to a range of pH from 7 to 4. Recombinant human (A), mouse (B), calcium-binding mutant (C), and cysteine to serine mutant (C39S) (D) adiponectin (25 μl, 1 mg/ml) were fractionated on a gel filtration column equilibrated in sodium citrate buffer adjusted to the pH indicated on the graph. The three peaks for the HMW, LMW, and trimer are indicated on the graph. The absorbance at 280 nm (mAU, milli-absorbance units) was plotted against the retention volume over the range at which adiponectin elutes. NS, Nonspecific peak that does not contain any protein.
Figure 9
Calcium binding affects the stability of adiponectin. Recombinant human adiponectin (200 μl of 4 mg/ml) was separated by gel filtration chromatography using a HiLoad 16/60 Superdex 200 column in either HEPES/Ca2+ buffer (A) or 1× PBS (B) without calcium. The absorbance of the purified protein (A280nm) at 280 nm is shown on the y-axis, and the retention volume is shown on the x-axis. Note the difference in scale of the y-axis between A and B. Recombinant calcium-binding mutant adiponectin (50 μl of 1 mg/ml) was separated by gel filtration chromatography using a Superdex 200 10/300 GL column in either HEPES/Ca2+ buffer (C) or 1× PBS (D) with no calcium.
Figure 10
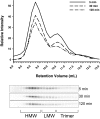
Stability of fluorescent-labeled adiponectin complexes in circulation. Adiponectin was labeled with an IRDye 800 fluorescent label and administered iv into mice by a retroorbital injection of 0.5 μg/g body weight. Blood samples were collected by tail vein bleeding at the indicated time points. Serum samples (20 μl) were separated by gel filtration, and fractions of 0.215 ml were collected. Each fraction was separated over an SDS-PAGE gel, and the gels were scanned on the Odyssey LI-COR scanner. The fluorescent signal was quantified over the range of the retention volume that adiponectin elutes, and clear peaks for HMW, LMW, and trimer are seen.
Similar articles
- Adiponectin multimerization is dependent on conserved lysines in the collagenous domain: evidence for regulation of multimerization by alterations in posttranslational modifications.
Richards AA, Stephens T, Charlton HK, Jones A, Macdonald GA, Prins JB, Whitehead JP. Richards AA, et al. Mol Endocrinol. 2006 Jul;20(7):1673-87. doi: 10.1210/me.2005-0390. Epub 2006 Feb 23. Mol Endocrinol. 2006. PMID: 16497731 - Complex distribution, not absolute amount of adiponectin, correlates with thiazolidinedione-mediated improvement in insulin sensitivity.
Pajvani UB, Hawkins M, Combs TP, Rajala MW, Doebber T, Berger JP, Wagner JA, Wu M, Knopps A, Xiang AH, Utzschneider KM, Kahn SE, Olefsky JM, Buchanan TA, Scherer PE. Pajvani UB, et al. J Biol Chem. 2004 Mar 26;279(13):12152-62. doi: 10.1074/jbc.M311113200. Epub 2003 Dec 29. J Biol Chem. 2004. PMID: 14699128 - Synthetic peptides designed to modulate adiponectin assembly improve obesity-related metabolic disorders.
Hampe L, Xu C, Harris PWR, Chen J, Liu M, Middleditch M, Radjainia M, Wang Y, Mitra AK. Hampe L, et al. Br J Pharmacol. 2017 Dec;174(23):4478-4492. doi: 10.1111/bph.14050. Epub 2017 Nov 2. Br J Pharmacol. 2017. PMID: 28945274 Free PMC article. - Adiponectin--a key adipokine in the metabolic syndrome.
Whitehead JP, Richards AA, Hickman IJ, Macdonald GA, Prins JB. Whitehead JP, et al. Diabetes Obes Metab. 2006 May;8(3):264-80. doi: 10.1111/j.1463-1326.2005.00510.x. Diabetes Obes Metab. 2006. PMID: 16634986 Review. - Post-translational modifications of adiponectin: mechanisms and functional implications.
Wang Y, Lam KS, Yau MH, Xu A. Wang Y, et al. Biochem J. 2008 Feb 1;409(3):623-33. doi: 10.1042/BJ20071492. Biochem J. 2008. PMID: 18177270 Review.
Cited by
- Adiponectin-induced activation of ERK1/2 drives fibrosis in retinal pigment epithelial cells.
Palanisamy K, Karpagavalli M, Nareshkumar RN, Ramasubramanyan S, Angayarkanni N, Raman R, Chidambaram S. Palanisamy K, et al. Hum Cell. 2024 Oct 26;38(1):8. doi: 10.1007/s13577-024-01131-5. Hum Cell. 2024. PMID: 39460900 - Effects of training and detraining on adiponectin plasma concentration and muscle sensitivity in lean and overweight men.
Gastebois C, Villars C, Drai J, Canet-Soulas E, Blanc S, Bergouignan A, Lefai E, Simon C. Gastebois C, et al. Eur J Appl Physiol. 2016 Dec;116(11-12):2135-2144. doi: 10.1007/s00421-016-3466-z. Epub 2016 Sep 8. Eur J Appl Physiol. 2016. PMID: 27632382 Clinical Trial. - The Dual Role of the Pervasive "Fattish" Tissue Remodeling With Age.
Conte M, Martucci M, Sandri M, Franceschi C, Salvioli S. Conte M, et al. Front Endocrinol (Lausanne). 2019 Feb 26;10:114. doi: 10.3389/fendo.2019.00114. eCollection 2019. Front Endocrinol (Lausanne). 2019. PMID: 30863366 Free PMC article. Review. - In utero gender dimorphism of adiponectin reflects insulin sensitivity and adiposity of the fetus.
Basu S, Laffineuse L, Presley L, Minium J, Catalano PM, Hauguel-de Mouzon S. Basu S, et al. Obesity (Silver Spring). 2009 Jun;17(6):1144-9. doi: 10.1038/oby.2008.667. Epub 2009 Feb 5. Obesity (Silver Spring). 2009. PMID: 19197253 Free PMC article. - Globular adiponectin counteracts VCAM-1-mediated monocyte adhesion via AdipoR1/NF-κB/COX-2 signaling in human aortic endothelial cells.
Addabbo F, Nacci C, De Benedictis L, Leo V, Tarquinio M, Quon MJ, Montagnani M. Addabbo F, et al. Am J Physiol Endocrinol Metab. 2011 Dec;301(6):E1143-54. doi: 10.1152/ajpendo.00208.2011. Epub 2011 Sep 6. Am J Physiol Endocrinol Metab. 2011. PMID: 21900123 Free PMC article.
References
- Hu E, Liang P, Spiegelman BM 1996 AdipoQ is a novel adipose-specific gene dysregulated in obesity. J Biol Chem 271:10697–10703 - PubMed
- Maeda K, Okubo K, Shimomura I, Funahashi T, Matsuzawa Y, Matsubara K 1996 cDNA cloning and expression of a novel adipose specific collagen-like factor, apM1 (adipose most abundant gene transcript 1). Biochem Biophys Res Commun 221:286–289 - PubMed
- Scherer PE, Williams S, Fogliano M, Baldini G, Lodish HF 1995 A novel serum protein similar to C1q, produced exclusively in adipocytes. J Biol Chem 270:26746–26749 - PubMed
- Pajvani UB, Du X, Combs TP, Berg AH, Rajala MW, Schulthess T, Engel J, Brownlee M, Scherer PE 2003 Structure-function studies of the adipocyte-secreted hormone Acrp30/adiponectin. Implications for metabolic regulation and bioactivity. J Biol Chem 278:9073–9085 - PubMed
- Waki H, Yamauchi T, Kamon J, Ito Y, Uchida S, Kita S, Hara K, Hada Y, Vasseur F, Froguel P, Kimura S, Nagai R, Kadowaki T 2003 Impaired multimerization of human adiponectin mutants associated with diabetes. Molecular structure and multimer formation of adiponectin. J Biol Chem 278:40352–40363 - PubMed
Publication types
MeSH terms
Substances
Grants and funding
- R21DK075887/DK/NIDDK NIH HHS/United States
- T32 HL007675T/HL/NHLBI NIH HHS/United States
- R01-DK55758/DK/NIDDK NIH HHS/United States
- T32 HL007675/HL/NHLBI NIH HHS/United States
- R01-CA112023/CA/NCI NIH HHS/United States
- R24 DK071030/DK/NIDDK NIH HHS/United States
- R24-DK071030-01/DK/NIDDK NIH HHS/United States
- R01 CA112023/CA/NCI NIH HHS/United States
- R21 DK075887/DK/NIDDK NIH HHS/United States
- R01 DK055758/DK/NIDDK NIH HHS/United States
LinkOut - more resources
Full Text Sources
Other Literature Sources
Molecular Biology Databases
