The genetic structure of Pacific Islanders - PubMed (original) (raw)
doi: 10.1371/journal.pgen.0040019.
Françoise R Friedlaender, Floyd A Reed, Kenneth K Kidd, Judith R Kidd, Geoffrey K Chambers, Rodney A Lea, Jun-Hun Loo, George Koki, Jason A Hodgson, D Andrew Merriwether, James L Weber
Affiliations
- PMID: 18208337
- PMCID: PMC2211537
- DOI: 10.1371/journal.pgen.0040019
The genetic structure of Pacific Islanders
Jonathan S Friedlaender et al. PLoS Genet. 2008 Jan.
Erratum in
- PLoS Genet. 2008 Mar;4(3). doi: 10.1371/annotation/cbdd11a0-4a29-4e7c-9e4e-c00a184c7777
Abstract
Human genetic diversity in the Pacific has not been adequately sampled, particularly in Melanesia. As a result, population relationships there have been open to debate. A genome scan of autosomal markers (687 microsatellites and 203 insertions/deletions) on 952 individuals from 41 Pacific populations now provides the basis for understanding the remarkable nature of Melanesian variation, and for a more accurate comparison of these Pacific populations with previously studied groups from other regions. It also shows how textured human population variation can be in particular circumstances. Genetic diversity within individual Pacific populations is shown to be very low, while differentiation among Melanesian groups is high. Melanesian differentiation varies not only between islands, but also by island size and topographical complexity. The greatest distinctions are among the isolated groups in large island interiors, which are also the most internally homogeneous. The pattern loosely tracks language distinctions. Papuan-speaking groups are the most differentiated, and Austronesian or Oceanic-speaking groups, which tend to live along the coastlines, are more intermixed. A small "Austronesian" genetic signature (always <20%) was detected in less than half the Melanesian groups that speak Austronesian languages, and is entirely lacking in Papuan-speaking groups. Although the Polynesians are also distinctive, they tend to cluster with Micronesians, Taiwan Aborigines, and East Asians, and not Melanesians. These findings contribute to a resolution to the debates over Polynesian origins and their past interactions with Melanesians. With regard to genetics, the earlier studies had heavily relied on the evidence from single locus mitochondrial DNA or Y chromosome variation. Neither of these provided an unequivocal signal of phylogenetic relations or population intermixture proportions in the Pacific. Our analysis indicates the ancestors of Polynesians moved through Melanesia relatively rapidly and only intermixed to a very modest degree with the indigenous populations there.
Conflict of interest statement
Competing interests. The authors have declared that no competing interests exist.
Figures
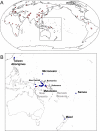
Figure 1. Populations Included in This Study
(A) HGDP-CEPH population locations. The two Pacific groups are boxed. (B) Pacific population locations. Our population samples are blue; the 2 HGDP-CEPH Melanesian “Oceanic” groups are red.
Figure 2. Population Diversity
Values of θ̂ for the HGDP-CEPH and Pacific datasets, for 687 microsatellites. Populations are ordered by their declining values of θ̂, but systematic regional distinctions are indicated by vertical lines. Conglomerate groups tend to have higher values than nearby populations (Bantu South, Sepik, Highlands, Micronesia, Samoa, and Columbia). Papuan-speaking groups are in bold italics; the Melanesian inland/shore distinction is indicated by the two shades of orange. Abbreviated names are spelled out in Table S1.
Figure 3. Genetic versus Geographic Distances within Continents
Regional correlations between F ST and geographic distance for population pairs.
Figure 4. Global Population Structure
STRUCTURE analysis of the Pacific and HGDP-CEPH sets combined, for 687 microsatellites and 203 indels over 91 populations encompassing 1,893 samples (20,000/10,000 burnin/MCMC). Each vertical line represents an individual. The colors represent the proportion of inferred ancestry from K ancestral populations.
Figure 5. Global Population Tree
Neighbor-joining F ST-based tree for the Pacific and HGDP-CEPH combined datasets (687 microsatellites). Superimposed colors are from the STRUCTURE analysis at K = 6 (also shown).
Figure 6. Pacific Population Structure
STRUCTURE analysis of the Pacific, HGDP-CEPH East Asia, and European (French) groups (687 microsatellites and 203 indels, 20,000/10,000 burnin/MCMC). Results are given from K = 2 to K = 10. Each vertical line represents an individual. The colors represent the proportion of inferred ancestry from K ancestral populations.
Figure 7. Pacific Population Structure Details
Individual and (below) mean population assignments at K = 10 for the Pacific, HGDP-CEPH East Asia, and French. Purple arrows denote the eight Oceanic-speaking populations with an “Austronesian” assignment signature above 5%. Papuan-speaking group names are in bold italics. Asterisks denote inland groups. Populations are arranged geographically, approximately from west to east.
Figure 8. The Geographic Patterning of STRUCTURE Results
Distribution of cluster assignment percentages (in pie-charts) among Northern Island Melanesian populations for _K=_10. Oceanic-speaking regions are stippled; the different Papuan-speaking regions have stripes or grid marks. Papuan-speaking group names are in bold italics. Inland group locations are dark orange dots; shore group locations are light orange dots. Baining (Mali) and Baining (Kaket) are two dialects; elsewhere, the two Kaket-speaking locales are identified (Rangulit and Malasait), as is Marabu (Mali-speakers).
Figure 9. Pacific Population Tree
Neighbor-joining F ST-based tree for 687 microsatellites from the Pacific, East Asia, and French populations, with the range of bootstrap values indicated by branch thicknesses. Colors are the same as in the STRUCTURE analysis at K = 10. New Britain populations are circled. Papuan-speaking groups are in bold italics; inland groups in Melanesia have asterisks. Abbreviated names are spelled out in Table S1.
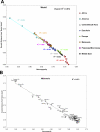
Figure 10. The Correlation between Genetic Distances and Heterozygosity
The genetic distances used were the set of pairwise F STs involving Bantu South (the population with the highest heterozygosity), highlighted in Table S4. (A) The combined global dataset. (B) Details for Melanesia.
Similar articles
- Depressing time: Waiting, melancholia, and the psychoanalytic practice of care.
Salisbury L, Baraitser L. Salisbury L, et al. In: Kirtsoglou E, Simpson B, editors. The Time of Anthropology: Studies of Contemporary Chronopolitics. Abingdon: Routledge; 2020. Chapter 5. In: Kirtsoglou E, Simpson B, editors. The Time of Anthropology: Studies of Contemporary Chronopolitics. Abingdon: Routledge; 2020. Chapter 5. PMID: 36137063 Free Books & Documents. Review. - The impact of the Austronesian expansion: evidence from mtDNA and Y chromosome diversity in the Admiralty Islands of Melanesia.
Kayser M, Choi Y, van Oven M, Mona S, Brauer S, Trent RJ, Suarkia D, Schiefenhövel W, Stoneking M. Kayser M, et al. Mol Biol Evol. 2008 Jul;25(7):1362-74. doi: 10.1093/molbev/msn078. Epub 2008 Apr 3. Mol Biol Evol. 2008. PMID: 18390477 - Falls prevention interventions for community-dwelling older adults: systematic review and meta-analysis of benefits, harms, and patient values and preferences.
Pillay J, Gaudet LA, Saba S, Vandermeer B, Ashiq AR, Wingert A, Hartling L. Pillay J, et al. Syst Rev. 2024 Nov 26;13(1):289. doi: 10.1186/s13643-024-02681-3. Syst Rev. 2024. PMID: 39593159 Free PMC article. - Qualitative evidence synthesis informing our understanding of people's perceptions and experiences of targeted digital communication.
Ryan R, Hill S. Ryan R, et al. Cochrane Database Syst Rev. 2019 Oct 23;10(10):ED000141. doi: 10.1002/14651858.ED000141. Cochrane Database Syst Rev. 2019. PMID: 31643081 Free PMC article. - Pharmacological treatments in panic disorder in adults: a network meta-analysis.
Guaiana G, Meader N, Barbui C, Davies SJ, Furukawa TA, Imai H, Dias S, Caldwell DM, Koesters M, Tajika A, Bighelli I, Pompoli A, Cipriani A, Dawson S, Robertson L. Guaiana G, et al. Cochrane Database Syst Rev. 2023 Nov 28;11(11):CD012729. doi: 10.1002/14651858.CD012729.pub3. Cochrane Database Syst Rev. 2023. PMID: 38014714 Free PMC article. Review.
Cited by
- AN ANCIENT DNA PACIFIC JOURNEY: A CASE STUDY OF COLLABORATION BETWEEN ARCHAEOLOGISTS AND GENETICISTS.
Spriggs M, Reich D. Spriggs M, et al. World Archaeol. 2019;51(4):620-639. doi: 10.1080/00438243.2019.1733069. Epub 2020 Mar 17. World Archaeol. 2019. PMID: 39564545 Free PMC article. - Native Hawaiian and Pacific Islander populations in genomic research.
Ha EK, Shriner D, Callier SL, Riley L, Adeyemo AA, Rotimi CN, Bentley AR. Ha EK, et al. NPJ Genom Med. 2024 Sep 30;9(1):45. doi: 10.1038/s41525-024-00428-6. NPJ Genom Med. 2024. PMID: 39349931 Free PMC article. Review. - Case report: Unveiling a less severe congenital nephrotic syndrome in a Rapa Nui patient with a NPHS1 Maori founder variant.
Krall P, Rojo A, Plaza A, Canals S, Ceballos ML, Cano F, Guerrero JL. Krall P, et al. Front Nephrol. 2024 May 14;4:1379061. doi: 10.3389/fneph.2024.1379061. eCollection 2024. Front Nephrol. 2024. PMID: 38808020 Free PMC article. - Indigenous Australian genomes show deep structure and rich novel variation.
Silcocks M, Farlow A, Hermes A, Tsambos G, Patel HR, Huebner S, Baynam G, Jenkins MR, Vukcevic D, Easteal S, Leslie S; National Centre for Indigenous Genomics. Silcocks M, et al. Nature. 2023 Dec;624(7992):593-601. doi: 10.1038/s41586-023-06831-w. Epub 2023 Dec 13. Nature. 2023. PMID: 38093005 Free PMC article. - An HLA map of the world: A comparison of HLA frequencies in 200 worldwide populations reveals diverse patterns for class I and class II.
Arrieta-Bolaños E, Hernández-Zaragoza DI, Barquera R. Arrieta-Bolaños E, et al. Front Genet. 2023 Mar 23;14:866407. doi: 10.3389/fgene.2023.866407. eCollection 2023. Front Genet. 2023. PMID: 37035735 Free PMC article.
References
- Friedlaender JS, editor. Genes, language, and culture history in the Southwest Pacific. New York: Oxford University Press; 2007.
- Green RC. Near and remote Oceania—Disestablishing “Melanesia” in culture history. In: Pawley A, editor. Man and a half: Essays in Pacific anthropology and ethnobiology in honour of Ralph Bulmer. Auckland: The Polynesian Society; 1991. pp. 491–502.
- Summerhayes GR. Island Melanesian Pasts—A view from archaeology. In: Friedlaender JS, editor. Genes, language, and culture history in the Southwest Pacific. New York: Oxford University Press; 2007. pp. 10–35.
- Wickler S, Spriggs M. Pleistocene human occupation of the Solomon Islands, Melanesia. Antiquity. 1988;62:703–706.
- Leavesley M, Chappell J. Buang Merabak: additional early radiocarbon evidence of the colonisation of the Bismarck Archipelago, Papua New Guinea. Antiquity Project Gallery. 2004. Available: http://antiquity.ac.uk/ProjGall/leavesley/index.html. Accessed 20 December 2007.
Publication types
MeSH terms
Substances
LinkOut - more resources
Full Text Sources
Research Materials
Miscellaneous


