SHP-1 deficiency and increased inflammatory gene expression in PBMCs of multiple sclerosis patients - PubMed (original) (raw)
SHP-1 deficiency and increased inflammatory gene expression in PBMCs of multiple sclerosis patients
George P Christophi et al. Lab Invest. 2008 Mar.
Abstract
Recent studies in mice have demonstrated that the protein tyrosine phosphatase SHP-1 is a crucial negative regulator of cytokine signaling, inflammatory gene expression, and demyelination in central nervous system. The present study investigates a possible similar role for SHP-1 in the human disease multiple sclerosis (MS). The levels of SHP-1 protein and mRNA in PBMCs of MS patients were significantly lower compared to normal subjects. Moreover, promoter II transcripts, expressed from one of two known promoters, were selectively deficient in MS patients. To examine functional consequences of the lower SHP-1 in PBMCs of MS patients, we measured the intracellular levels of phosphorylated STAT6 (pSTAT6). As expected, MS patients had significantly higher levels of pSTAT6. Accordingly, siRNA to SHP-1 effectively increased the levels of pSTAT6 in PBMCs of controls to levels equal to MS patients. Additionally, transduction of PBMCs with a lentiviral vector expressing SHP-1 lowered pSTAT6 levels. Finally, multiple STAT6-responsive inflammatory genes were increased in PBMCs of MS patients relative to PBMCs of normal subjects. Thus, PBMCs of MS patients display a stable deficiency of SHP-1 expression, heightened STAT6 phosphorylation, and an enhanced state of activation relevant to the mechanisms of inflammatory demyelination.
Figures
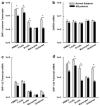
Figure 1
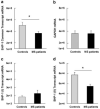
SHP-1 mRNA levels in freshly isolated PBMCs of MS patients and normal subjects. The absolute mRNA transcript copy numbers per 10 ng of total RNA were quantified using real-time RT-PCR in MS patients (n = 23) and normal subjects (n = 18). (a) Using primers in the mid-region of the SHP-1 gene that would amplify both SHP-1 transcripts, the levels of the common SHP-1 transcripts were measured (*significance of P < 0.05). (b) The mRNA levels of the housekeeping gene GAPDH were quantified between MS patients and normal subjects. (c) Sequence-specific primers to the SHP-1 gene were used to quantify the expression of the SHP-1 promoter I transcripts. (d) Similarly, sequence-specific primers allowed the quantification of the SHP-1 promoter II transcripts.
Figure 2
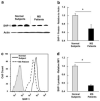
SHP-1 protein expression in cultured PBMCs of MS patients compared to normal subjects. (a) Western blot analysis of SHP-1 and actin in PBMCs of MS patients compared to normal subjects. (b) The Western immunoblot protein bands of MS patients (n = 7) and control subjects (n = 7) were analyzed with Scion Image software program and the average levels of SHP-1 relative to actin are shown (*significance of P < 0.05). (c) SHP-1 protein levels of MS patients (n = 12) and normal subjects (n = 12) were measured with intracellular flow cytometry. The histograms are labeled as follows: filled histogram for isotype control, solid line for normal subject, and dashed line for MS patient. (d) SHP-1 expression measured by flow cytometry was quantified using the mean florescence intensity (MFI).
Figure 3
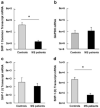
SHP-1 mRNA levels in cultured PBMCs of MS patients compared to normal subjects. The absolute mRNA transcript copy numbers per 10 ng of total RNA were quantified using real-time RT-PCR in MS patients (n = 23) and normal subjects (n = 18). (a) The levels of the common SHP-1 transcript, (b) the housekeeping gene GAPDH, (c) the SHP-1 promoter I transcripts, and (d) the SHP-1 promoter II transcripts were quantified with real-time RT-PCR in cultured PBMCs of MS patients and normal subjects (*significance of P < 0.05).
Figure 4
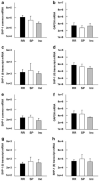
SHP-1 mRNA levels in freshly isolated (a–d) or cultured (e–h) PBMCs of patients diagnosed with different clinical subclassifications of MS. The absolute specific mRNA transcript numbers per 10 ng of total RNA were quantified with real-time RT-PCR in patients with active relapsing-remitting (RR) MS (n = 10), active secondary progressive (SP) MS (n = 6), or inactive RR (Inc) MS (n = 7). The mRNA levels of the (a) common SHP-1 transcript, (b) housekeeping gene GAPDH, (c) SHP-1 promoter I transcripts, and (d) SHP-1 promoter II transcripts were quantified in freshly isolated PBMCs of MS patients. Similarly, the mRNA levels of (e) the common SHP-1 transcript, (f) the housekeeping gene GAPDH, (g) SHP-1 promoter I transcripts, and (h) SHP-1 promoter II transcripts were quantified in PBMCs of MS patients that were cultured for 1 week.
Figure 5
Quantification of the SHP-1 mRNA in different cell types of MS patients and normal subjects. The absolute mRNA transcript copy numbers per 10 ng of total RNA were quantified with real-time RT-PCR in MS patients (n = 23) and normal subjects (n = 18). Cultured PBMCs were sorted into T cells, B cells, monocytes, and negatively stained cells. Using sequence-specific primers the levels of (a) the common SHP-1 transcripts, (b) GAPDH mRNA levels, (c) SHP-1 promoter I transcripts, and (d) SHP-1 promoter II transcripts were quantified using real-time RT-PCR in the different cell types of both MS patients and normal subjects (*significance of P < 0.05).
Figure 6
Total STAT6 and phosphorylated STAT6 (pSTAT6) levels in cultured PBMCs of MS patients compared to normal subjects. PBMCs from MS patients and normal controls were fixed, permeabilized, and stained with antibodies against either total STAT6 (unphosphorylated plus phosphorylated STAT6) or pSTAT6. The histogram overlays are labeled as follows: filled histogram for isotype control, solid line for normal subject, and dashed line for MS patient. (a) The representative levels of total STAT6 in MS patients and normal subjects are shown after quantification with intracellular flow cytometry. (b) The levels of tSTAT6 were quantified based on the relative MFI in PBMCs of MS patients (n = 9) and normal subjects (n = 8) before and after treatment with IL-4. (c) The representative levels of pSTAT6 in MS patients and normal subjects are shown. (d) The levels of pSTAT6 were quantified based on the relative MFI in PBMCs of MS patients (n = 16) and normal subjects (n = 13) before and after treatment with IL-4 (*significance of P < 0.05).
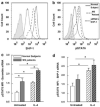
Figure 7
pSTAT6 levels in PBMCs after siRNA treatment against SHP-1. Cultured PBMCs from MS patients and normal subjects were stained with antibodies against the phosphorylated form of STAT6 (pSTAT6) or against SHP-1. The histogram overlays are labeled as follows: filled histogram for isotype control, solid line for normal subject, dashed line for MS patient, and dotted line for PBMCs treated with siRNA against SHP-1. (a) SHP-1 and (b) pSTAT6 expression in PBMCs of normal subjects, MS patients, and PBMCs treated with siRNA against SHP-1. (c) PBMCs were pretreated with scramble (nonspecific) siRNA and the levels of pSTAT6 were measured in MS patients (n = 6) and normal subjects (n = 6) before and after IL-4 treatment. (d) PBMCs were treated with siRNA against SHP-1 and the levels of pSTAT6 were measured both in MS patients (n = 6) and normal subjects (n = 6) before and after IL-4 treatment (*significance of P < 0.05).
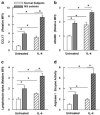
Figure 8
Protein levels of STAT6-inducible genes in MS patients were verified using flow cytometry and enzymatic assays. (a) CCL17/TARC, (b) ADAM8 and (c) lymphotoxin-α protein levels were measured using flow cytometry in cultured PBMCs of MS patients (n = 7) and normal subjects (n = 6) before and after treatment with IL-4. Protein expression was quantified using the mean florescence intensity (MFI) and are reported relative to the untreated control samples. (d) Arginase activity was measured in PBMCs of MS patients and normal subjects and is shown relative to the untreated control samples (*significance of P < 0.05).
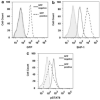
Figure 9
PBMCs of MS patients were transduced with a lentiviral vector co-expressing GFP and SHP-1. Cells were sorted into two populations, GFP negative (solid line) or GFP positive (dashed line). The sorted aliquots were then analyzed for the expression of (a) GFP, (b) SHP-1 and (c) pSTAT6 using flow cytometry.
Similar articles
- Macrophages of multiple sclerosis patients display deficient SHP-1 expression and enhanced inflammatory phenotype.
Christophi GP, Panos M, Hudson CA, Christophi RL, Gruber RC, Mersich AT, Blystone SD, Jubelt B, Massa PT. Christophi GP, et al. Lab Invest. 2009 Jul;89(7):742-59. doi: 10.1038/labinvest.2009.32. Epub 2009 Apr 27. Lab Invest. 2009. PMID: 19398961 Free PMC article. - Interferon-beta treatment in multiple sclerosis attenuates inflammatory gene expression through inducible activity of the phosphatase SHP-1.
Christophi GP, Panos M, Hudson CA, Tsikkou C, Mihai C, Mejico LJ, Jubelt B, Massa PT. Christophi GP, et al. Clin Immunol. 2009 Oct;133(1):27-44. doi: 10.1016/j.clim.2009.05.019. Epub 2009 Jun 25. Clin Immunol. 2009. PMID: 19559654 Free PMC article. - The SHP-1 expression is associated with cytokines and psychopathological status in unmedicated first episode schizophrenia patients.
Pesce M, Ferrone A, Rizzuto A, Tatangelo R, Iezzi I, Ladu S, Franceschelli S, Speranza L, Patruno A, Felaco M, Grilli A. Pesce M, et al. Brain Behav Immun. 2014 Oct;41:251-60. doi: 10.1016/j.bbi.2014.04.008. Epub 2014 Apr 30. Brain Behav Immun. 2014. PMID: 24793756 - Increased promoter methylation of the immune regulatory gene SHP-1 in leukocytes of multiple sclerosis subjects.
Kumagai C, Kalman B, Middleton FA, Vyshkina T, Massa PT. Kumagai C, et al. J Neuroimmunol. 2012 May 15;246(1-2):51-7. doi: 10.1016/j.jneuroim.2012.03.003. Epub 2012 Mar 27. J Neuroimmunol. 2012. PMID: 22458980 Free PMC article. - Inverse regulation of inducible nitric oxide synthase (iNOS) and arginase I by the protein tyrosine phosphatase SHP-1 in CNS glia.
Bonaparte KL, Hudson CA, Wu C, Massa PT. Bonaparte KL, et al. Glia. 2006 Jun;53(8):827-35. doi: 10.1002/glia.20344. Glia. 2006. PMID: 16565987
Cited by
- The control of reactive oxygen species production by SHP-1 in oligodendrocytes.
Gruber RC, LaRocca D, Minchenberg SB, Christophi GP, Hudson CA, Ray AK, Shafit-Zagardo B, Massa PT. Gruber RC, et al. Glia. 2015 Oct;63(10):1753-71. doi: 10.1002/glia.22842. Epub 2015 Apr 27. Glia. 2015. PMID: 25919645 Free PMC article. - Identification of key genes associated with multiple sclerosis based on gene expression data from peripheral blood mononuclear cells.
Shang Z, Sun W, Zhang M, Xu L, Jia X, Zhang R, Fu S. Shang Z, et al. PeerJ. 2020 Feb 3;8:e8357. doi: 10.7717/peerj.8357. eCollection 2020. PeerJ. 2020. PMID: 32117605 Free PMC article. - A Precision B Cell-Targeted Therapeutic Approach to Autoimmunity Caused by Phosphatidylinositol 3-Kinase Pathway Dysregulation.
Franks SE, Getahun A, Cambier JC. Franks SE, et al. J Immunol. 2019 Jun 15;202(12):3381-3393. doi: 10.4049/jimmunol.1801394. Epub 2019 May 10. J Immunol. 2019. PMID: 31076529 Free PMC article. - A transcription factor map as revealed by a genome-wide gene expression analysis of whole-blood mRNA transcriptome in multiple sclerosis.
Riveros C, Mellor D, Gandhi KS, McKay FC, Cox MB, Berretta R, Vaezpour SY, Inostroza-Ponta M, Broadley SA, Heard RN, Vucic S, Stewart GJ, Williams DW, Scott RJ, Lechner-Scott J, Booth DR, Moscato P; ANZgene Multiple Sclerosis Genetics Consortium. Riveros C, et al. PLoS One. 2010 Dec 1;5(12):e14176. doi: 10.1371/journal.pone.0014176. PLoS One. 2010. PMID: 21152067 Free PMC article. - Non-receptor tyrosine kinase signaling in autoimmunity and therapeutic implications.
Solouki S, August A, Huang W. Solouki S, et al. Pharmacol Ther. 2019 Sep;201:39-50. doi: 10.1016/j.pharmthera.2019.05.008. Epub 2019 May 11. Pharmacol Ther. 2019. PMID: 31082431 Free PMC article. Review.
References
- Noseworthy JH, Lucchinetti C, Rodriguez M, et al. Multiple sclerosis. N Engl J Med. 2000;343:938–952. - PubMed
- Kornek B, Lassmann H. Neuropathology of multiple sclerosis—new concepts. Brain Res Bull. 2003;61:321–326. - PubMed
- Gobin SJ, Montagne L, Van Zutphen M, et al. Upregulation of transcription factors controlling MHC expression in multiple sclerosis lesions. Glia. 2001;36:68–77. - PubMed
- Frisullo G, Angelucci F, Caggiula M, et al. pSTAT1, pSTAT3, and T-bet expression in peripheral blood mononuclear cells from relapsing–remitting multiple sclerosis patients correlates with disease activity. J Neurosci Res. 2006;84:1027–1036. - PubMed
- Cannella B, Raine CS. Multiple sclerosis: cytokine receptors on oligodendrocytes predict innate regulation. Ann Neurol. 2004;55:46–57. - PubMed
Publication types
MeSH terms
Substances
LinkOut - more resources
Full Text Sources
Medical
Research Materials
Miscellaneous
