Gene characterization index: assessing the depth of gene annotation - PubMed (original) (raw)
Gene characterization index: assessing the depth of gene annotation
Danielle Kemmer et al. PLoS One. 2008.
Abstract
Background: We introduce the Gene Characterization Index, a bioinformatics method for scoring the extent to which a protein-encoding gene is functionally described. Inherently a reflection of human perception, the Gene Characterization Index is applied for assessing the characterization status of individual genes, thus serving the advancement of both genome annotation and applied genomics research by rapid and unbiased identification of groups of uncharacterized genes for diverse applications such as directed functional studies and delineation of novel drug targets.
Methodology/principal findings: The scoring procedure is based on a global survey of researchers, who assigned characterization scores from 1 (poor) to 10 (extensive) for a sample of genes based on major online resources. By evaluating the survey as training data, we developed a bioinformatics procedure to assign gene characterization scores to all genes in the human genome. We analyzed snapshots of functional genome annotation over a period of 6 years to assess temporal changes reflected by the increase of the average Gene Characterization Index. Applying the Gene Characterization Index to genes within pharmaceutically relevant classes, we confirmed known drug targets as high-scoring genes and revealed potentially interesting novel targets with low characterization indexes. Removing known drug targets and genes linked to sequence-related patent filings from the entirety of indexed genes, we identified sets of low-scoring genes particularly suited for further experimental investigation.
Conclusions/significance: The Gene Characterization Index is intended to serve as a tool to the scientific community and granting agencies for focusing resources and efforts on unexplored areas of the genome. The Gene Characterization Index is available from http://cisreg.ca/gci/.
Conflict of interest statement
Competing Interests: The authors have declared that no competing interests exist.
Figures
Figure 1. GCI Model Cross-validation Performance.
GCI Predictor Performance–Leave-One-Out cross-validation results for the final GCI predictor model utilizing the MARS method on z-score normalized data. The X-axis displays average evaluator assigned scores, while the Y-axis displays the predicted scores for each gene in the leave-one-out cross validation analysis (the score assigned when the gene was not included in the training data). As observed, the MARS model can assign scores greater than 10 (in all further analysis such scores are rounded down to 10).
Figure 2. Genome-wide GCI Score Distribution.
Histogram displaying the frequency of scores observed in the analysis of genes at 3 different time points after the release of the first draft of the human genome sequence. Genes based only on predictions and/or EST sequences have been removed (∼3000 genes in 2007 data).
Figure 3. Resnik Scores for Depth of GO Gene Annotation Correspond with GCI Scores.
The Resnik score describes the granularity of annotations attached to each gene. There is an overall Pearson correlation of 0.6 between GCI and Resnik scores. The distribution plot shows the distribution of Resnik scores for ranges of GCI scores.
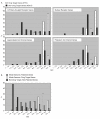
Figure 4. A. Distribution of GCI Scores for Genes in Selected Protein Families and Classes.
750 G Protein-Coupled Recptors: 79 DTG, 671 NDTG; 50 Nuclear Receptors: 23 DTG, 27 NDTG; 66 Ligand-Gated Ion Channels: 21 DTG, 45 NDTG; 111 Potassium Ion Channels: 14 DTG, 97 NDTG. B. Genome-wide GCI Score Distribution for Drug Targets, Patented and All Other Genes. Based on genome release July 2006: 1095 drug targets, 14237 patented, 14913 non-target, non-patented genes. 10867 non-targeted, non-patented genes were highly uncharacterized with GCI scores <3.5.
Figure 5. Evolution of Patented versus Non-Patented Genes between 2001 and 2007.
Histogram presenting substantial differences in annotation progress between patented and non-patented genes. Fluctuating gene numbers due to changes in genome annotations and transcript mappings.
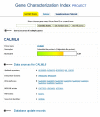
Figure 6. Screenshot of GCI Web Page.
Example of Calmodulin-like protein 6 returned by GCI search engine with gene-specific GCI score and links to data sources.
Similar articles
- An Experimental Approach to Genome Annotation: This report is based on a colloquium sponsored by the American Academy of Microbiology held July 19-20, 2004, in Washington, DC.
[No authors listed] [No authors listed] Washington (DC): American Society for Microbiology; 2004. Washington (DC): American Society for Microbiology; 2004. PMID: 33001599 Free Books & Documents. Review. - A procedure for assessing GO annotation consistency.
Dolan ME, Ni L, Camon E, Blake JA. Dolan ME, et al. Bioinformatics. 2005 Jun;21 Suppl 1:i136-43. doi: 10.1093/bioinformatics/bti1019. Bioinformatics. 2005. PMID: 15961450 - Evidence-based gene models for structural and functional annotations of the oil palm genome.
Chan KL, Tatarinova TV, Rosli R, Amiruddin N, Azizi N, Halim MAA, Sanusi NSNM, Jayanthi N, Ponomarenko P, Triska M, Solovyev V, Firdaus-Raih M, Sambanthamurthi R, Murphy D, Low EL. Chan KL, et al. Biol Direct. 2017 Sep 8;12(1):21. doi: 10.1186/s13062-017-0191-4. Biol Direct. 2017. PMID: 28886750 Free PMC article. - DAVID Bioinformatics Resources: expanded annotation database and novel algorithms to better extract biology from large gene lists.
Huang DW, Sherman BT, Tan Q, Kir J, Liu D, Bryant D, Guo Y, Stephens R, Baseler MW, Lane HC, Lempicki RA. Huang DW, et al. Nucleic Acids Res. 2007 Jul;35(Web Server issue):W169-75. doi: 10.1093/nar/gkm415. Epub 2007 Jun 18. Nucleic Acids Res. 2007. PMID: 17576678 Free PMC article. - [Development of antituberculous drugs: current status and future prospects].
Tomioka H, Namba K. Tomioka H, et al. Kekkaku. 2006 Dec;81(12):753-74. Kekkaku. 2006. PMID: 17240921 Review. Japanese.
Cited by
- Searching for signaling balance through the identification of genetic interactors of the Rab guanine-nucleotide dissociation inhibitor gdi-1.
Lee AY, Perreault R, Harel S, Boulier EL, Suderman M, Hallett M, Jenna S. Lee AY, et al. PLoS One. 2010 May 13;5(5):e10624. doi: 10.1371/journal.pone.0010624. PLoS One. 2010. PMID: 20498707 Free PMC article. - GIFtS: annotation landscape analysis with GeneCards.
Harel A, Inger A, Stelzer G, Strichman-Almashanu L, Dalah I, Safran M, Lancet D. Harel A, et al. BMC Bioinformatics. 2009 Oct 23;10:348. doi: 10.1186/1471-2105-10-348. BMC Bioinformatics. 2009. PMID: 19852797 Free PMC article. - Systematic identification and characterization of novel human skin-associated genes encoding membrane and secreted proteins.
Gerber PA, Hevezi P, Buhren BA, Martinez C, Schrumpf H, Gasis M, Grether-Beck S, Krutmann J, Homey B, Zlotnik A. Gerber PA, et al. PLoS One. 2013 Jun 20;8(6):e63949. doi: 10.1371/journal.pone.0063949. Print 2013. PLoS One. 2013. PMID: 23840300 Free PMC article. - Re-annotation is an essential step in systems biology modeling of functional genomics data.
van den Berg BH, McCarthy FM, Lamont SJ, Burgess SC. van den Berg BH, et al. PLoS One. 2010 May 14;5(5):e10642. doi: 10.1371/journal.pone.0010642. PLoS One. 2010. PMID: 20498845 Free PMC article. - Synthetic lethality guiding selection of drug combinations in ovarian cancer.
Heinzel A, Marhold M, Mayer P, Schwarz M, Tomasich E, Lukas A, Krainer M, Perco P. Heinzel A, et al. PLoS One. 2019 Jan 25;14(1):e0210859. doi: 10.1371/journal.pone.0210859. eCollection 2019. PLoS One. 2019. PMID: 30682083 Free PMC article.
References
- Bogue MA, Grubb SC. The Mouse Phenome Project. Genetica. 2004;122:71–74. - PubMed
- Mashimo T, Voigt B, Kuramoto T, Serikawa T. Rat Phenome Project: the untapped potential of existing rat strains. J Appl Physiol. 2005;98:371–379. - PubMed
Publication types
MeSH terms
LinkOut - more resources
Full Text Sources


