Blocking TNF-alpha in mice reduces colorectal carcinogenesis associated with chronic colitis - PubMed (original) (raw)
Blocking TNF-alpha in mice reduces colorectal carcinogenesis associated with chronic colitis
Boryana K Popivanova et al. J Clin Invest. 2008 Feb.
Abstract
The inflammatory bowel disease ulcerative colitis (UC) frequently progresses to colon cancer. To understand the mechanisms by which UC patients develop colon carcinomas, we used a mouse model of the disease whereby administration of azoxymethane (AOM) followed by repeated dextran sulfate sodium (DSS) ingestion causes severe colonic inflammation and the subsequent development of multiple tumors. We found that treating WT mice with AOM and DSS increased TNF-alpha expression and the number of infiltrating leukocytes expressing its major receptor, p55 (TNF-Rp55), in the lamina propria and submucosal regions of the colon. This was followed by the development of multiple colonic tumors. Mice lacking TNF-Rp55 and treated with AOM and DSS showed reduced mucosal damage, reduced infiltration of macrophages and neutrophils, and attenuated subsequent tumor formation. WT mice transplanted with TNF-Rp55-deficient bone marrow also developed significantly fewer tumors after AOM and DSS treatment than either WT mice or TNF-Rp55-deficient mice transplanted with WT bone marrow. Furthermore, administration of etanercept, a specific antagonist of TNF-alpha, to WT mice after treatment with AOM and DSS markedly reduced the number and size of tumors and reduced colonic infiltration by neutrophils and macrophages. These observations identify TNF-alpha as a crucial mediator of the initiation and progression of colitis-associated colon carcinogenesis and suggest that targeting TNF-alpha may be useful in treating colon cancer in individuals with UC.
Figures
Figure 1. Tumor formation in WT and TNF-Rp55–/– (TNF-Rp55KO) mice after AOM and DSS treatment.
(A) Schematic overview of this colon carcinogenesis model. (B) Macroscopical changes in colon. Colons were removed at day 56 from treated WT and TNF-Rp55–/– mice, and representative results from 10 independent animals are shown here. (C) The numbers of tumors. Colons were removed at day 56 to determine the numbers of macroscopic tumors. Each value represents the mean ± SD (n = 10 animals). **P < 0.01 versus WT. (D). _TNF-_α gene expression in the colons of WT mice. The levels of _TNF-_α mRNA were quantified by quantitative RT-PCR as described in Methods, and normalized to the level of GAPDH mRNA. *P < 0.05, **P < 0.01 versus untreated (control) mice. (E and F) Immunohistochemical detection of TNF-α and TNF-Rp55 in colons. Colons were obtained from WT mice at the indicated time intervals; insets are higher magnification of the positively stained cells as indicated by arrows. Representative results from 6 independent experiments are shown here (original magnification, ×400; ×1,000 [insets]).
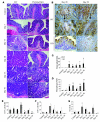
Figure 2. Microscopical analysis of colon tissues.
(A) Colons were removed at the indicated time intervals, fixed, and stained with hematoxylin and eosin. Representative results from 5 mice are shown here. Original magnification, ×200. (B) Immunohistochemical staining for β-catenin. Colons were removed at the indicated time intervals from WT and TNF-Rp55–/– (TNF-Rp55KO) mice and immunostained with anti–β-catenin antibody as described in Methods. Boxed areas in the left panels are shown at higher magnification in the middle panels. Representative results from 3 independent animals are shown here. Original magnification, ×400 (top and bottom rows), ×1,000 (middle row). (C–G) The numbers of myeloperoxidase- (C), F4/80- (D), CD4- (E), CD8- (F), and DEC205-positive cells (G) were counted as described in Methods and are shown here. All values represent the mean ± SD (n = 10 animals). *P < 0.05, **P < 0.01 versus untreated (control) WT mice.
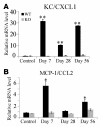
Figure 3. Chemokine gene expression in the colons.
Quantitative RT-PCR was performed on total RNAs extracted from the colons at the indicated time intervals as described in Methods. The levels of KC/CXCL1 (A) and MCP-1/CCL2 (B) mRNA were normalized to GAPDH mRNA levels. Representative results from 5 independent experiments are shown in here. *P < 0.05, **P < 0.01 versus untreated (control) mice.
Figure 4. Colon tumor formation in bone marrow chimeric mice.
Bone marrow chimeric mice were generated and subjected to AOM+DSS treatment as described in Methods. Colons were removed at day 56, and the tumor numbers were determined macroscopically. The bars represent the median of each group; each symbol represents the tumor numbers of each animal. **P < 0.01.
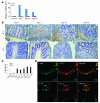
Figure 5. COX-2 expression in the colons.
(A) Quantitative RT-PCR was performed on total RNAs extracted from the colons at the indicated time intervals as described in Methods. The levels of COX-2 mRNA were normalized to the levels of GAPDH mRNA. **P < 0.01 versus untreated (control) mice. (B–D) Immunohistochemical and immunofluorescence detection of COX-2–expressing cells. Colons were obtained from WT mice at the indicated time intervals and processed for immunohistochemical analysis using anti–COX-2 antibodies, and representative results from 5 independent animals are shown in B. The numbers of COX-2–expressing cells were determined as described in Methods and are shown in C and expressed as mean ± SD. *P < 0.05, **P < 0.01 versus untreated. Double-color immunofluorescence analysis was performed with the combination of anti–COX-2 and anti–F4/80 (D, top row) or that of anti–COX-2 and anti-Ly6G antibodies (D, bottom row). Representative results from 5 independent experiments are shown here. Original magnification, ×400 (B); ×800 (D). Scale bars, 10 μm.
Figure 6. The effects of a TNF antagonist, etanercept, on colon carcinogenesis.
(A) Schematic overview of etanercept administration. Colons were removed at day 67 after the mice were administered etanercept (Et) or a vehicle control between days 56 and 60. (B) The tumor sizes and numbers were determined macroscopically. The bars represent the median of each group. Each symbol represents the tumor numbers of each animal or the average size of the tumors of each animal. (C) Macroscopic evaluation of the tumors. Colons were removed on day 67 from WT mice, treated with etanercept or with vehicle. Representative results from 10 independent animals are shown here. Original magnification, ×6. (D) Colons were processed for hematoxylin and eosin staining and representative results from 5 independent animals are shown here. Original magnification, ×40. (E and F) Myeloperoxidase- (E) and F4/80-positive cells (F) were enumerated as described in Methods. All values represent the mean ± SD (n = 10 animals). *P < 0.05, **P < 0.01 versus etanercept-untreated WT mice. (G and H) Quantitative RT-PCR analysis for KC/CXCL1 (G) and MCP-1/CCL2 (H) was performed on total RNAs extracted from the colons at the indicated time intervals as described in Methods. KC/CXCL1 and MCP-1/CCL2 mRNA levels were normalized to the levels of GAPDH mRNA. *P < 0.05, **P < 0.01 versus etanercept untreated WT mice.
Figure 7. The effect of etanercept on COX-2 expression and angiogenesis.
(A) Quantitative RT-PCR analysis for COX-2 was performed on total RNAs extracted from the colons at the indicated time intervals as described in Methods. The levels of COX-2 mRNA were normalized to the levels of GAPDH mRNA. *P < 0.05 versus untreated (control) mice. (B and C) Immunohistochemical analysis with anti–COX-2 antibody was performed on colons from WT mice as described in Methods. Boxed area in B is shown at higher magnification. Representative results from 5 independent animals are shown in B (original magnification, ×400; ×1,000 [insets]). The numbers of COX-2 expressing cells were determined on 5 independent animals as described in Methods. The mean and SD were calculated on all values and are shown in C. *P < 0.05 versus untreated mice. (D and E) Colon tissues were immunostained with anti-CD31 antibody as described in Methods. Representative results from 5 independent animals are shown in D. Arrows in D indicate capillary vessels. Original magnification, ×400. The vascular densities were determined as described in Methods and are shown in E. All values represent the mean ± SD. *P < 0.05 versus untreated mice.
Figure 8. The effect of etanercept on β-catenin nuclear translocation.
(A) Colons were immunostained with anti–β-catenin (upper panels) or anti–cytokeratin 20 antibody (lower panels) and representative results from 5 independent animals are shown. Insets are higher magnifications of the positively stained cells, indicated by arrows. Original magnification, ×400; ×1,000 (insets). (B) The β-catenin nuclear localization ratio was determined as the ratio of the numbers of tumor nuclei with β-catenin localization to the total number of tumor nuclei per field. At least 5 randomly chosen fields at ×400 magnification were examined. All values represent the mean ± SD. **P < 0.01 versus etanercept untreated WT mice. (C) Immunoblotting analysis with anti–β-catenin antibodies was performed on cell lysates from colon tissues as described in Methods. Representative results from 3 independent experiments are shown here. (D) The numbers of cytokeratin 20–positive cells were determined on 5 randomly chosen visual fields at ×400 magnification. All values represent the mean ± SD. **P < 0.01 versus etanercept untreated WT mice.
Comment in
- Colitis and cancer: a tale of inflammatory cells and their cytokines.
Burstein E, Fearon ER. Burstein E, et al. J Clin Invest. 2008 Feb;118(2):464-7. doi: 10.1172/JCI34831. J Clin Invest. 2008. PMID: 18219390 Free PMC article.
References
- Fiocchi C. Inflammatory bowel disease: Etiology and pathogenesis. Gastroenterology. 1998;115:182–205. - PubMed
- Risques R.A., Rabinovitch P.S., Brentnall T.A. Cancer surveillance in inflammatory bowel disease: new molecular approaches. Curr. Opin. Gastroenterol. 2006;22:382–390. - PubMed
- Ullman T., Croog V., Harpaz N., Sachar D., Itzkowitz S. Progression of flat low-grade dysplasia to advanced neoplasia in patients with ulcerative colitis. Gastroenterology. 2003;125:1311–1319. - PubMed
- Dobbins W.O., 3rd. Dysplasia and malignancy in inflammatory bowel disease. Annu. Rev. Med. 1984;35:33–48. - PubMed
- Okayasu I., et al. A novel method in the induction of reliable experimental acute and chronic ulcerative colitis in mice. Gastroenterology. . 1990;98:694–702. - PubMed
MeSH terms
Substances
LinkOut - more resources
Full Text Sources
Other Literature Sources
Medical
Molecular Biology Databases


