Epidermal stem cells are retained in vivo throughout skin aging - PubMed (original) (raw)
Epidermal stem cells are retained in vivo throughout skin aging
Adam Giangreco et al. Aging Cell. 2008 Mar.
Abstract
In healthy individuals, skin integrity is maintained by epidermal stem cells which self-renew and generate daughter cells that undergo terminal differentiation. It is currently unknown whether epidermal stem cells influence or are affected by skin aging. We therefore compared young and aged skin stem cell abundance, organization, and proliferation. We discovered that despite age-associated differences in epidermal proliferation, dermal thickness, follicle patterning, and immune cell abundance, epidermal stem cells were maintained at normal levels throughout life. These findings, coupled with observed dermal gene expression changes, suggest that epidermal stem cells themselves are intrinsically aging resistant and that local environmental or systemic factors modulate skin aging.
Figures
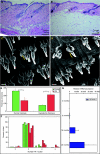
Fig. 1
Age-associated changes in murine skin. (A, B) Haematoxylin-and-eosin-stained sections of young (A) and old (B) telogen murine dorsal skin showing epidermis, dermis, hypodermis, and underlying muscle. Abnormal follicular architecture, dermal thinning, and hypodermal thickening are present in aged skin. (C, D) Keratin 14-stained skin whole-mount images from young (C) and old (D) mice [bracket indicates hair follicle (HF) bulge]. (E) Average dermis (measured from epidermis to hypodermis) and hypodermis (measured from dermis to underlying muscle) thickness in young (green) and old (red) mice. (F) Average number of HFs per cluster in young (green) and old (red) tail epidermis. (G) Quantitative polymerase chain reaction analysis of p16/Ink4a/Arf gene expression in skin of mice of increasing age. Scale bars = 100 µm (A, B, D, E). (n = 4 mice/age; *P < 0.05).
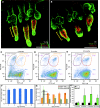
Fig. 2
Epidermal stem cells are maintained during skin aging. (A, B) Representative epidermal whole mounts from young and old mice stained for keratin 14 (green) plus the stem cell marker keratin 15 (red) to identify hair follicle bulge stem cells. (C–E) Representative flow cytometry plots from 2-month-old (C), 6-month-old (D), and 22-month-old (E) murine epidermal skin preparations stained for CD34-PE and α6 integrin–FITC. Three distinct epidermal populations are shown: α6(+) basal cells (blue gate), α6(+)/CD34(+) stem cells (orange gate), and α6(dim)/CD34(+) cells (grey gate). (F) Quantification of the per cent of viable cells represented within the α6(+) gated population from epidermal preparations of n = 3 mice/age at each of 2 months, 6 months, 12 months, 18 months, or 22 months. (G) Quantification of the per cent of viable cells represented as α6(+)/CD34(+) stem cell (orange bars) or α6(dim)/CD34(+) stem cell (grey bars) populations. No significant differences in stem cell abundance were observed between 6 months and 22 months age. (H) Quantitative polymerase chain reaction analysis of whole-skin RNA for α6 (black bars) and keratin 15 (green bars) levels in 2-month-old, 6-month-old, 18-month-old, and 22-month-old mice. Scale bars = 100 µm (A, B). Asterisk (G, H) indicates significant difference versus 2-month sample; P < 0.05.
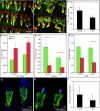
Fig. 3
Interfollicular epidermal proliferation declines with aging. (A, B) Representative young (A) and old (B) epidermal whole mounts stained for keratin 14 (green) plus Ki67 (red). (C) Quantification of Ki67(+) nuclei per interfollicular epidermis unit (defined in Silva-Vargas et al., 2005) in young and old mice. (D–F) Flow cytometric analysis of total (left side graphs, C–E) or α6(+) keratinocyte (right side graphs, C–E) cell cycle status in young (green) versus old (red) skin preparations. (G, H) Keratin 15 (green) plus Ki67 (red) immunostaining in young and old mice to determine bulge stem-cell-specific proliferation. (I) Quantification of Ki67(+) cells per bulge in young and old mice. Scale bars (A, B) = 100 µm. (n = 4 mice/age; *P < 0.05).
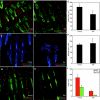
Fig. 4
Aging results in altered skin leukocyte abundance. (A, B) Representative whole mounts from young (A) and old (B) tail epidermis stained for the pan-haematopoietic marker CD45 (red) and the keratinocyte-specific marker keratin 14 (green). (C) Quantification of CD45(+) cells present per square millimetre of tissue. (D, E) Young (D) and old (E) epidermal whole mounts stained to reveal haematopoietic Langerhans cells (DEC205, red). (F) Quantification of DEC205(+) cells per square millimetre of epidermis. (G, H) Whole-mount immunostaining for T cell populations using antibodies to the pan-T cell marker CD3 (red) and γδ-T cell receptor (γδ-TCR; green) to identify dendritic epidermal T cells (DETCs, orange dual stain). (I) Quantification of CD3 (red) and γδTCR/CD3 dual (green) positive cells per square millimetre of epidermis. All images and quantification represent at least n = 3 individuals/age. Scale bars = 200 µm (A, B); 100 µm (C–F).
Fig. 5
Skin aging results in changes in Igfbp3 transcript abundance. (A) Bioinformatic analysis of relative Igf/Igfbp signalling pathway gene abundance in matrix (green), outer root sheath (ORS, black), dermal fibroblast (DF, red), dermal papilla (DP, yellow), or melanocyte (blue) cell populations relative to ORS/basal keratinocytes. Most Igf pathway members were enriched within dermal compartments (DF and DP). (B) Quantitative polymerase chain reaction of whole-skin cDNA to determine Igf/Igfbp expression in 2-month-old, 6-month-old, 18-month-old, and 22-month-old mice. (n = 3 mice/age; *P < 0.05).
Fig. 6
Igfbp3 does not directly influence epidermal immune cell abundance but results in increased anagen follicles. (A, B) Representative whole mounts from age- and sex-matched wild-type (WT) (A) and Igfbp3KO (B) tail epidermis immunolabelled for keratin 14 (green) and CD45 (red). (C) Quantification of CD45 cell abundance in WT and knock-out (KO) epidermis per square millimetre. (D, E) WT (D) and KO (E) whole mounts stained for γδTCR (green) and CD3 (red) identify CD3(+) T cells and dendritic epidermal T cells (orange). (F) Quantification of CD3(+) and γδTCR(+) cell abundance in WT and KO skin. (G, H) WT (G) and KO (H) tail whole mounts stained for keratin 15 (green) and Ki67 (red) to identify bulge stem cells and mitotic keratinocytes, respectively. (I) Quantification of percentage of total growing (anagen) follicles present in WT and KO tail epidermal whole mounts (e.g. see arrowheads, H). Scale bars = 100 µm (A, B, D, E, G, H). (n = 4 mice/genotype; *P < 0.05; I).
Similar articles
- The aging skin microenvironment dictates stem cell behavior.
Ge Y, Miao Y, Gur-Cohen S, Gomez N, Yang H, Nikolova M, Polak L, Hu Y, Verma A, Elemento O, Krueger JG, Fuchs E. Ge Y, et al. Proc Natl Acad Sci U S A. 2020 Mar 10;117(10):5339-5350. doi: 10.1073/pnas.1901720117. Epub 2020 Feb 24. Proc Natl Acad Sci U S A. 2020. PMID: 32094197 Free PMC article. - Human skin stem cells and the ageing process.
Zouboulis CC, Adjaye J, Akamatsu H, Moe-Behrens G, Niemann C. Zouboulis CC, et al. Exp Gerontol. 2008 Nov;43(11):986-97. doi: 10.1016/j.exger.2008.09.001. Epub 2008 Sep 9. Exp Gerontol. 2008. PMID: 18809487 Review. - TLR7-expressing cells comprise an interfollicular epidermal stem cell population in murine epidermis.
Yin C, Zhang T, Qiao L, Du J, Li S, Zhao H, Wang F, Huang Q, Meng W, Zhu H, Bu H, Li H, Xu H, Mo X. Yin C, et al. Sci Rep. 2014 Jul 25;4:5831. doi: 10.1038/srep05831. Sci Rep. 2014. PMID: 25060222 Free PMC article. - Hair Follicle and Sebaceous Gland De Novo Regeneration With Cultured Epidermal Stem Cells and Skin-Derived Precursors.
Wang X, Wang X, Liu J, Cai T, Guo L, Wang S, Wang J, Cao Y, Ge J, Jiang Y, Tredget EE, Cao M, Wu Y. Wang X, et al. Stem Cells Transl Med. 2016 Dec;5(12):1695-1706. doi: 10.5966/sctm.2015-0397. Epub 2016 Jul 25. Stem Cells Transl Med. 2016. PMID: 27458264 Free PMC article. - Stem Cells in Dermatology and Anti-aging Care of the Skin.
Taub AF, Pham K. Taub AF, et al. Facial Plast Surg Clin North Am. 2018 Nov;26(4):425-437. doi: 10.1016/j.fsc.2018.06.004. Epub 2018 Aug 16. Facial Plast Surg Clin North Am. 2018. PMID: 30213424 Review.
Cited by
- AIMP1-Derived Peptide Secreted from Hair Follicle Stem Cells Promotes Hair Growth by Activating Dermal Papilla Cells.
Kim Y, Kim SB, Lee H, Kim D, Bak SS, Yoon I, Cho S, Jeong SJ, Jeon Y, Kim J, Kim JH, Oh S, Battogtokh KE, Park MC, Sung YK, Kim S. Kim Y, et al. Int J Biol Sci. 2024 Oct 21;20(14):5764-5778. doi: 10.7150/ijbs.101127. eCollection 2024. Int J Biol Sci. 2024. PMID: 39494335 Free PMC article. - Epidermal stem cells: skin surveillance and clinical perspective.
Tang X, Wang J, Chen J, Liu W, Qiao P, Quan H, Li Z, Dang E, Wang G, Shao S. Tang X, et al. J Transl Med. 2024 Aug 22;22(1):779. doi: 10.1186/s12967-024-05600-1. J Transl Med. 2024. PMID: 39169334 Free PMC article. Review. - Effects of RF Electric Currents on Hair Follicle Growth and Differentiation: A Possible Treatment for Alopecia.
Martínez-Pascual MA, Sacristán S, Toledano-Macías E, Naranjo P, Hernández-Bule ML. Martínez-Pascual MA, et al. Int J Mol Sci. 2024 Jul 18;25(14):7865. doi: 10.3390/ijms25147865. Int J Mol Sci. 2024. PMID: 39063106 Free PMC article. - Characterization of Skin Interfollicular Stem Cells and Early Transit Amplifying Cells during the Transition from Infants to Young Children.
Quadri M, Baudouin C, Lotti R, Palazzo E, Campanini L, Bernard FX, Bellemere G, Pincelli C, Marconi A. Quadri M, et al. Int J Mol Sci. 2024 May 22;25(11):5635. doi: 10.3390/ijms25115635. Int J Mol Sci. 2024. PMID: 38891823 Free PMC article. - A novel method for the establishment of autologous skin cell suspensions: characterisation of cellular sub-populations, epidermal stem cell content and wound response-enhancing biological properties.
Peake M, Dunnill C, Ibraheem K, Smith A, Clarke DJ, Georgopoulos NT. Peake M, et al. Front Bioeng Biotechnol. 2024 Apr 5;12:1386896. doi: 10.3389/fbioe.2024.1386896. eCollection 2024. Front Bioeng Biotechnol. 2024. PMID: 38646012 Free PMC article.
References
- Blanpain C, Lowry WE, Geoghegan A, Polak L, Fuchs E. Self-renewal, multipotency, and the existence of two cell populations within an epithelial stem cell niche. Cell. 2004;118:635–648. - PubMed
- Braun KM, Niemann C, Jensen UB, Sundberg JP, Silva-Vargas V, Watt FM. Manipulation of stem cell proliferation and lineage commitment: visualisation of label-retaining cells in wholemounts of mouse epidermis. Development. 2003;130:5241–5255. - PubMed
- Edmondson SR, Thumiger SP, Werther GA, Wraight CJ. Epidermal homeostasis: the role of the growth hormone and insulin-like growth factor systems. Endocr. Rev. 2003;24:737–764. - PubMed
- Edmondson SR, Thumiger SP, Kaur P, Loh B, Koelmeyer R, Li A, Silha JV, Murphy LJ, Wraight CJ, Werther GA. Insulin-like growth factor binding protein-3 (IGFBP-3) localizes to and modulates proliferative epidermal keratinocytes in vivo. Br. J. Dermatol. 2005;152:225–230. - PubMed
Publication types
MeSH terms
Substances
LinkOut - more resources
Full Text Sources
Other Literature Sources
Medical
Molecular Biology Databases


