Co-regulation of metabolic genes is better explained by flux coupling than by network distance - PubMed (original) (raw)
Co-regulation of metabolic genes is better explained by flux coupling than by network distance
Richard A Notebaart et al. PLoS Comput Biol. 2008 Jan.
Abstract
To what extent can modes of gene regulation be explained by systems-level properties of metabolic networks? Prior studies on co-regulation of metabolic genes have mainly focused on graph-theoretical features of metabolic networks and demonstrated a decreasing level of co-expression with increasing network distance, a naïve, but widely used, topological index. Others have suggested that static graph representations can poorly capture dynamic functional associations, e.g., in the form of dependence of metabolic fluxes across genes in the network. Here, we systematically tested the relative importance of metabolic flux coupling and network position on gene co-regulation, using a genome-scale metabolic model of Escherichia coli. After validating the computational method with empirical data on flux correlations, we confirm that genes coupled by their enzymatic fluxes not only show similar expression patterns, but also share transcriptional regulators and frequently reside in the same operon. In contrast, we demonstrate that network distance per se has relatively minor influence on gene co-regulation. Moreover, the type of flux coupling can explain refined properties of the regulatory network that are ignored by simple graph-theoretical indices. Our results underline the importance of studying functional states of cellular networks to define physiologically relevant associations between genes and should stimulate future developments of novel functional genomic tools.
Conflict of interest statement
Competing interests. The authors have declared that no competing interests exist.
Figures
Figure 1. A Hypothetical Network with Metabolites (Nodes), Reactions (Arrows), and Exchange Reactions (Ex) with the Environment
Indicated are three types of flux coupling between reactions that are located at distance 1 (directly connected by one node): i) A-B: directionally coupled, ii) B-C: fully coupled, and iii) C-D: uncoupled.
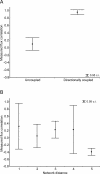
Figure 2. The Average Level of Empirically Determined Flux Correlations for Different Flux Coupling Types (A) and at Different Network Distances (B)
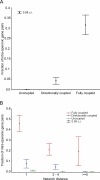
Figure 3. The Effect of Flux Coupling and Network Distance on Operonic Organization in E. coli
(A) The fraction of intra-operonic gene pairs correlates with the type of flux coupling. The dashed baseline indicates the fraction of intra-operonic gene pairs expected by chance. (B) The effect of flux coupling on the fraction of intra-operonic gene pairs in different network distance groups: χ2 d=1 = 715.3, χ2 d=2,3,4 = 5347.3, χ2 d≥5 = 5022.3, d.f. = 2, and p < 10−155.
Figure 4. Transcription Factor (TF) Similarity Correlates with the Type of Flux Coupling
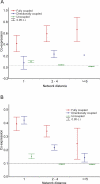
Figure 5. The Effect of Flux Coupling and Network Distance on Co-Expression for E. coli (A) and S. cerevisiae (B)
(A) The dashed baseline indicates the degree of co-expression between random gene pairs. The confidence interval of directionally coupled pairs at d ≥ 5 is absent, as it contains too few data points (n = 2) for reliable calculation. (B) Relative variance components (i.e., the fraction of total variance in co-expression explained by coupling and distance) were estimated by a general linear model where both flux coupling and distance were treated as random effects in an unbalanced factorial ANOVA design. Expected means squares were used for the estimation (Statistica 6.0, Statsoft). Flux coupling and network distance explain 16.8% and 7.3% of the variance in co-expression, respectively (interaction between the two factors explains 3.7%). A maximum likelihood estimation of variance components gave very similar results (coupling: 14%, distance: 7.1%, and interaction: 3.8%, Statistica 6.0, Statsoft). Note that the average network distance is ∼4.5.
Similar articles
- Decomposition of metabolic network into functional modules based on the global connectivity structure of reaction graph.
Ma HW, Zhao XM, Yuan YJ, Zeng AP. Ma HW, et al. Bioinformatics. 2004 Aug 12;20(12):1870-6. doi: 10.1093/bioinformatics/bth167. Epub 2004 Mar 22. Bioinformatics. 2004. PMID: 15037506 - Discovering functional gene expression patterns in the metabolic network of Escherichia coli with wavelets transforms.
König R, Schramm G, Oswald M, Seitz H, Sager S, Zapatka M, Reinelt G, Eils R. König R, et al. BMC Bioinformatics. 2006 Mar 8;7:119. doi: 10.1186/1471-2105-7-119. BMC Bioinformatics. 2006. PMID: 16524469 Free PMC article. - Dynamic regulation of metabolic flux in engineered bacteria using a pathway-independent quorum-sensing circuit.
Gupta A, Reizman IM, Reisch CR, Prather KL. Gupta A, et al. Nat Biotechnol. 2017 Mar;35(3):273-279. doi: 10.1038/nbt.3796. Epub 2017 Feb 13. Nat Biotechnol. 2017. PMID: 28191902 Free PMC article. - Gene module level analysis: identification to networks and dynamics.
Wang X, Dalkic E, Wu M, Chan C. Wang X, et al. Curr Opin Biotechnol. 2008 Oct;19(5):482-91. doi: 10.1016/j.copbio.2008.07.011. Epub 2008 Sep 3. Curr Opin Biotechnol. 2008. PMID: 18725293 Free PMC article. Review.
Cited by
- Predictive evolution of metabolic phenotypes using model-designed environments.
Jouhten P, Konstantinidis D, Pereira F, Andrejev S, Grkovska K, Castillo S, Ghiachi P, Beltran G, Almaas E, Mas A, Warringer J, Gonzalez R, Morales P, Patil KR. Jouhten P, et al. Mol Syst Biol. 2022 Oct;18(10):e10980. doi: 10.15252/msb.202210980. Mol Syst Biol. 2022. PMID: 36201279 Free PMC article. - Transformation to ischaemia tolerance of frog brain function corresponds to dynamic changes in mRNA co-expression across metabolic pathways.
Hu M, Santin JM. Hu M, et al. Proc Biol Sci. 2022 Jul 27;289(1979):20221131. doi: 10.1098/rspb.2022.1131. Epub 2022 Jul 27. Proc Biol Sci. 2022. PMID: 35892220 Free PMC article. - Diversity begets diversity during community assembly until ecological limits impose a diversity ceiling.
San Roman M, Wagner A. San Roman M, et al. Mol Ecol. 2021 Nov;30(22):5874-5887. doi: 10.1111/mec.16161. Epub 2021 Sep 22. Mol Ecol. 2021. PMID: 34478597 Free PMC article. - Interpretable Machine Learning Reveals Dissimilarities Between Subtypes of Autism Spectrum Disorder.
Garbulowski M, Smolinska K, Diamanti K, Pan G, Maqbool K, Feuk L, Komorowski J. Garbulowski M, et al. Front Genet. 2021 Feb 25;12:618277. doi: 10.3389/fgene.2021.618277. eCollection 2021. Front Genet. 2021. PMID: 33719335 Free PMC article. - Flux-based hierarchical organization of Escherichia coli's metabolic network.
Robaina-Estévez S, Nikoloski Z. Robaina-Estévez S, et al. PLoS Comput Biol. 2020 Apr 20;16(4):e1007832. doi: 10.1371/journal.pcbi.1007832. eCollection 2020 Apr. PLoS Comput Biol. 2020. PMID: 32310959 Free PMC article.
References
- Reed JL, Famili I, Thiele I, Palsson BO. Towards multidimensional genome annotation. Nat Rev Genet. 2006;7:130–141. - PubMed
- Ihmels J, Levy R, Barkai N. Principles of transcriptional control in the metabolic network of Saccharomyces cerevisiae . Nat Biotechnol. 2004;22:86–92. - PubMed
Publication types
MeSH terms
Substances
LinkOut - more resources
Full Text Sources


