Isoform-specific inhibition of TRPC4 channel by phosphatidylinositol 4,5-bisphosphate - PubMed (original) (raw)
Isoform-specific inhibition of TRPC4 channel by phosphatidylinositol 4,5-bisphosphate
Ken-ichi Otsuguro et al. J Biol Chem. 2008.
Abstract
Full-length transient receptor potential (TRP) cation channel TRPC4alpha and shorter TRPC4beta lacking 84 amino acids in the cytosolic C terminus are expressed in smooth muscle and endothelial cells where they regulate membrane potential and Ca(2+) influx. In common with other "classical" TRPCs, TRPC4 is activated by G(q)/phospholipase C-coupled receptors, but the underlying mechanism remains elusive. Little is also known about any isoform-specific channel regulation. Here we show that TRPC4alpha but not TRPC4beta was strongly inhibited by intracellularly applied phosphatidylinositol 4,5-bisphosphate (PIP(2)). In contrast, several other phosphoinositides (PI), including PI(3,4)P(2), PI(3,5)P(2), and PI(3,4,5)P(3), had no effect or even potentiated TRPC4alpha indicating that PIP(2) inhibits TRPC4alpha in a highly selective manner. We show that PIP(2) binds to the C terminus of TRPC4alpha but not that of TRPC4beta in vitro. Its inhibitory action was dependent on the association of TRPC4alpha with actin cytoskeleton as it was prevented by cytochalasin D treatment or by the deletion of the C-terminal PDZ-binding motif (Thr-Thr-Arg-Leu) that links TRPC4 to F-actin through the sodium-hydrogen exchanger regulatory factor and ezrin. PIP(2) breakdown appears to be a required step in TRPC4alpha channel activation as PIP(2) depletion alone was insufficient for channel opening, which additionally required Ca(2+) and pertussis toxin-sensitive G(i/o) proteins. Thus, TRPC4 channels integrate a variety of G-protein-dependent stimuli, including a PIP(2)/cytoskeleton dependence reminiscent of the TRPC4-like muscarinic agonist-activated cation channels in ileal myocytes.
Figures
FIGURE 1.
TRPC4 expression and activation in ileal myocytes and HEK293 cells. A, both TRPC4 isoforms are expressed in guinea pig ileal myocytes.Left, reverse transcription-PCR with amplified α-fragment (1422 bp) and β-fragment (1170 bp). Right, Western blot (150 μg of protein per lane). Lane 1, mouse brain wild type; lane 2, mouse brain TRPC4-/-; lane 3, guinea pig ileum. Loading control, CaVβ2. Arrows indicate TRPC4α and -β isoforms. B, Western blot of lysates from control HEK293 cells and stable cell lines expressing TRPC4α or -β. Loading control was actin. The difference between the TRPC4 isoforms is shown schematically in the_inset. C_ and D, carbachol-induced membrane potential and intracellular Ca2+ concentration ([Ca2+]i) changes in cells that expressed TRPC4α. Simultaneous measurement of membrane potential (C) and [Ca2+]i (D) changes in control HEK293 cells (gray lines) and the cell line that stably expressed TRPC4α (black lines). Carbachol (CCh) was added as indicated. Note that the signals represent an average from >100,000 cells.E, typical current response to carbachol application and mICAT I-V relationship in a guinea pig ileal myocyte (marked as_GP_). For comparison, I-V relationship of the GTPγS-induced current in a TRPC4β-expressing HEK293 cell is shown by the gray line, with superimposed thin black line showing current approximation according to I = G(V -_V_rev), where G is determined using Equation 1, and _V_rev is the current reversal potential (best fit values were Va =-36.8 mV, and Vi = 0.2 mV,sa =-23.4 mV and si = 8.6 mV).Circles show the I-V relationship measured in the same cell by the voltage-step protocol shown in F. F, superimposed current traces (top) and voltage step protocol used (bottom) illustrating voltage dependence of the GTPγS-induced current in a TRPC4β-expressing HEK293 cell. G, mean normalized GTPγS-induced cation conductance activation curves measured in TRPC4α-(squares, n = 47) and TRPC4β-expressing (circles, n = 37) HEK293 cells. Data points between -120 and 40 mV were approximated by Equation 1. See text for the best fit parameters.
FIGURE 2.
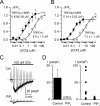
Enhanced sensitivity of membrane depolarization responses to carbachol in M5AChR coexpressing cells and PIP2 sensitivity of agonist-induced TRPC4α currents. A and B, membrane depolarization elicited by carbachol in stable cell lines that expressed TRPC4α (A) or TRPC4β (B) without (open symbols) or with coexpressed M5AChR (closed symbols) expressed as a relative maximum change in FLIPR membrane potential dye signal (Δ_F_/_F_0). Concentration-effect data are means ± S.E. (n = 6) and are fitted by the Hill equation with the corresponding EC50 values indicated near each trace. C, representative cation current responses to carbachol (100 μ
m
) application in control HEK293 cell expressing TRPC4α (top) and in the presence of 20 μ
m
diC8-PIP2 in the pipette solution (bottom). The horizontal bar indicating duration of agonist application applies to both traces. Dashed lines show zero current.D, left, mean current density measured at -60 mV under control conditions (n = 9) and with PIP2 in the pipette solution (n = 12). Right, data points measured in individual cells in control (squares) and with PIP2 (triangles).
FIGURE 3.
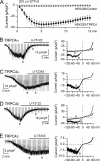
GTPγS activates TRPC4 in a PLC-dependent manner. A, averaged current amplitude induced at -40 mV by 200 μ
m
GTPγS infusion in control nontransfected cells (n = 5) and TRPC4-expressing cells (TRPC4α, n = 14 and TRPC4β, n = 7). Time 0 corresponds to the moment when the whole-cell configuration has been achieved. _B_-D, both TRPC4α and -β currents were inhibited by U-73122 (2.5 μ
m
) (B and D) but not affected by U-73343 (2.5 μ
m
) (C and E). Corresponding I-V relationships are shown on the right with times of their measurements indicated on the continuous recordings (a and b). Residual currents shown in B and D were similar to those seen in control nontransfected HEK293 cells.
FIGURE 4.
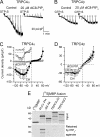
PIP2 selectively inhibits TRPC4α isoform and binds to its C terminus. A and B, representative TRPC4α and -β GTPγS-induced current responses in control and with 20 μ
m
diC8-PIP2 added to the pipette solution, as indicated. C and D, mean I-V relationships measured at maximal response to GTPγS in control and in the presence of diC8-PIP2 for the α and β isoforms of TRPC4 (n = 7-11). The inset in C shows I-V relation recorded with diC8-PIP2 on an extended current scale. E, in vitro binding study showing that the C terminus of TRPC4α-(733-974), but not that of TRPC4β-(733-890), binds to PIP2. Δ84AA contains the extra 84 amino acids in TRPC4α-(781-864) and shows weaker binding. PLCδ-PH was used as a positive control. MBP, maltose-binding protein.
FIGURE 5.
The association of TRPC4α with actin cytoskeleton is critical for PIP2-dependent channel inhibition. A, disruption of F-actin by cytochalasin D completely prevented TRPC4α inhibition by PIP2 (n = 9). B, in ΔTTRL mutant, the effect of PIP2 was also completely prevented (n = 10). C, coimmunoprecipitation of TRPC4α with ERMs and actin. Cell lysates from untransfected control HEK293 cells and stable lines expressing human TRPC3, C-terminal hemagglutinin-tagged murine TRPC4α (C4_α_-HAc), wild type TRPC4α, or ΔTTRL mutant were immunoprecipitated using goat anti-actin (middle) and goat anti-ezrin (lower) antibodies and then immunoblotted using a polyclonal anti-TRPC4 antibody. TRPC4α but not C4α-HAc or ΔTTRL was precipitated by the anti-actin and anti-ezrin antibodies. Upper panel is a Western blot of total cell lysates performed using the anti-TRPC4 antibody. D, proposed mechanistic model showing that PIP2 binding to the Δ84AA stretch (and likely to adjacent sites) present only in TRPC4α stabilizes its closed conformation and that interactions of TRPC4α with NHERF/ERM/F-actin are required for PIP2-dependent channel inactivation.
FIGURE 6.
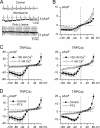
PIP2 inhibits native mICAT current in guinea pig ileal myocytes in an actin cytoskeleton-dependent manner. A, shortly after breakthrough with 20 μ
m
diC8-PIP2-containing patch pipette mICAT could be activated by carbachol but rapidly desensitized (gray trace is a representative control trace). B, in cytochalasin D-treated myocytes (n = 5) desensitization rate was similar or even slower than in control cells (compare with Ref. 18) despite the presence of 20 μ
m
diC8-PIP2 in the pipette solution. C, I-V relationships measured at times indicated in A. D, mean I-V relationships of mICAT in control cells or shortly after breakthrough with diC8-PIP2 in the pipette (n = 15) and at the steady-state inhibition by diC8-PIP2 (n = 9).
FIGURE 7.
Effects of PIP2 depletion and additional mechanisms of TRPC4 activation. A, PIP2 depletion by wortmannin or poly-
l
-lysine application induced relatively small currents.Top, TRPC4α-expressing cells were recorded in control with or without 0.2-0.3% Me2SO in the external solution and showed small background currents. Middle and bottom traces show currents recorded in wortmannin-treated cells or with 50 μg/ml PLL in the pipette solution, respectively. B, mean I-V relationships measured in wortmannin-treated cells (closed squares, n = 12) and with PLL in the pipette solution (open circles, n = 4).C, activation of both TRPC4 isoforms requires intracellular Ca2+ as evident from the lack of ITRPC4 under conditions of abnormally low intracellular Ca2+ level (Ca2+-free solution with 10 m
m
BAPTA, n = 6-8). D, PTX treatment abolished current responses both in TRPC4α- and β-expressing cells (n = 8-9).
FIGURE 8.
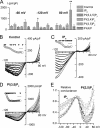
Effects of IP6 and other PIs on TRPC4αcurrents. A, mean current density at the maximal response to GTPγS infusion measured at three different test potentials in control (n = 7) and with IP6 (20 μ
m
, n = 7), PI(3,4,5)P3 (20 μ
m
, n = 7), PI(3,4)P2 (100 μ
m
, n = 6), PI(3,5)P2 (100 μ
m
, n = 5), or PI(4)P (200 μ
m
, n = 5); * and ** indicate_p_ < 0.05 and p < 0.02, respectively. B-D, examples of TRPC4α I-V relationships measured during the time course of GTPγS-induced current development in control (B) and with IP6 (C) or PI(3,5)P2 (D) in the pipette solution. The insets illustrate the time course of the current development (measured at the holding potential of -40 mV) with_triangles_ (plotted at zero current level) indicating moments when I-V relationships shown in the main plots were measured. Scale bars: 5 min in B and C and 10 min in D. Current scale is omitted because complete I-V relationships are shown. E, normalized and averaged activation curves obtained under these various conditions. Compared with control (circles) significant differences were seen in case of IP6 (squares) and PI(3,5)P2 (triangles); with other PIs the curves are shown by the gray lines overlapping with control.
Similar articles
- The phosphatidylinositol(4,5)bisphosphate-binding sequence of transient receptor potential channel canonical 4α is critical for its contribution to cardiomyocyte hypertrophy.
Cooley N, Grubb DR, Luo J, Woodcock EA. Cooley N, et al. Mol Pharmacol. 2014 Oct;86(4):399-405. doi: 10.1124/mol.114.093690. Epub 2014 Jul 21. Mol Pharmacol. 2014. PMID: 25049082 - Close spatio-association of the transient receptor potential canonical 4 (TRPC4) channel with Gαi in TRPC4 activation process.
Myeong J, Kwak M, Jeon JP, Hong C, Jeon JH, So I. Myeong J, et al. Am J Physiol Cell Physiol. 2015 Jun 1;308(11):C879-89. doi: 10.1152/ajpcell.00374.2014. Epub 2015 Mar 18. Am J Physiol Cell Physiol. 2015. PMID: 25788576 - TRPC4α and TRPC4β Similarly Affect Neonatal Cardiomyocyte Survival during Chronic GPCR Stimulation.
Kirschmer N, Bandleon S, von Ehrlich-Treuenstätt V, Hartmann S, Schaaf A, Lamprecht AK, Miranda-Laferte E, Langsenlehner T, Ritter O, Eder P. Kirschmer N, et al. PLoS One. 2016 Dec 19;11(12):e0168446. doi: 10.1371/journal.pone.0168446. eCollection 2016. PLoS One. 2016. PMID: 27992507 Free PMC article. - Ionic channels formed by TRPC4.
Cavalié A. Cavalié A. Handb Exp Pharmacol. 2007;(179):93-108. doi: 10.1007/978-3-540-34891-7_5. Handb Exp Pharmacol. 2007. PMID: 17217052 Review. - TRPC4- and TRPC4-containing channels.
Freichel M, Tsvilovskyy V, Camacho-Londoño JE. Freichel M, et al. Handb Exp Pharmacol. 2014;222:85-128. doi: 10.1007/978-3-642-54215-2_5. Handb Exp Pharmacol. 2014. PMID: 24756704 Review.
Cited by
- TRPC5 channel is the mediator of neurotrophin-3 in regulating dendritic growth via CaMKIIα in rat hippocampal neurons.
He Z, Jia C, Feng S, Zhou K, Tai Y, Bai X, Wang Y. He Z, et al. J Neurosci. 2012 Jul 4;32(27):9383-95. doi: 10.1523/JNEUROSCI.6363-11.2012. J Neurosci. 2012. PMID: 22764246 Free PMC article. - International Union of Basic and Clinical Pharmacology. LXXVI. Current progress in the mammalian TRP ion channel family.
Wu LJ, Sweet TB, Clapham DE. Wu LJ, et al. Pharmacol Rev. 2010 Sep;62(3):381-404. doi: 10.1124/pr.110.002725. Pharmacol Rev. 2010. PMID: 20716668 Free PMC article. Review. - Trans-activation response (TAR) RNA-binding protein 2 is a novel modulator of transient receptor potential canonical 4 (TRPC4) protein.
Zimmermann J, Latta L, Beck A, Leidinger P, Fecher-Trost C, Schlenstedt G, Meese E, Wissenbach U, Flockerzi V. Zimmermann J, et al. J Biol Chem. 2014 Apr 4;289(14):9766-80. doi: 10.1074/jbc.M114.557066. Epub 2014 Feb 21. J Biol Chem. 2014. PMID: 24563462 Free PMC article. - Obligatory role for phosphatidylinositol 4,5-bisphosphate in activation of native TRPC1 store-operated channels in vascular myocytes.
Saleh SN, Albert AP, Large WA. Saleh SN, et al. J Physiol. 2009 Feb 1;587(3):531-40. doi: 10.1113/jphysiol.2008.166678. Epub 2008 Dec 1. J Physiol. 2009. PMID: 19047197 Free PMC article. - Cell-type-specific CCK2 receptor signaling underlies the cholecystokinin-mediated selective excitation of hippocampal parvalbumin-positive fast-spiking basket cells.
Lee SY, Földy C, Szabadics J, Soltesz I. Lee SY, et al. J Neurosci. 2011 Jul 27;31(30):10993-1002. doi: 10.1523/JNEUROSCI.1970-11.2011. J Neurosci. 2011. PMID: 21795548 Free PMC article.
References
- Ramsey, I. S., Delling, M., and Clapham, D. E. (2006) Annu. Rev. Physiol. 68 619-647 - PubMed
- Plant, T. D., and Schaefer, M. (2005) Naunyn-Schmiedeberg's Arch. Pharmacol. 371 266-276 - PubMed
- Rohacs, T. (2007) Pfluegers Arch. 453 753-762 - PubMed
Publication types
MeSH terms
Substances
Grants and funding
- R21 NS056942/NS/NINDS NIH HHS/United States
- R01 NS042183-02/NS/NINDS NIH HHS/United States
- P30 NS045758/NS/NINDS NIH HHS/United States
- P30 NS045758-049003/NS/NINDS NIH HHS/United States
- R21 NS056942-01/NS/NINDS NIH HHS/United States
- R01 NS042183/NS/NINDS NIH HHS/United States
- R01 NS042183-03/NS/NINDS NIH HHS/United States
- P30 NS045758-039003/NS/NINDS NIH HHS/United States
- P30 NS045758-01A29003/NS/NINDS NIH HHS/United States
- R01 NS042183-04/NS/NINDS NIH HHS/United States
LinkOut - more resources
Full Text Sources
Other Literature Sources
Molecular Biology Databases
Research Materials
Miscellaneous

